

November Newsletter
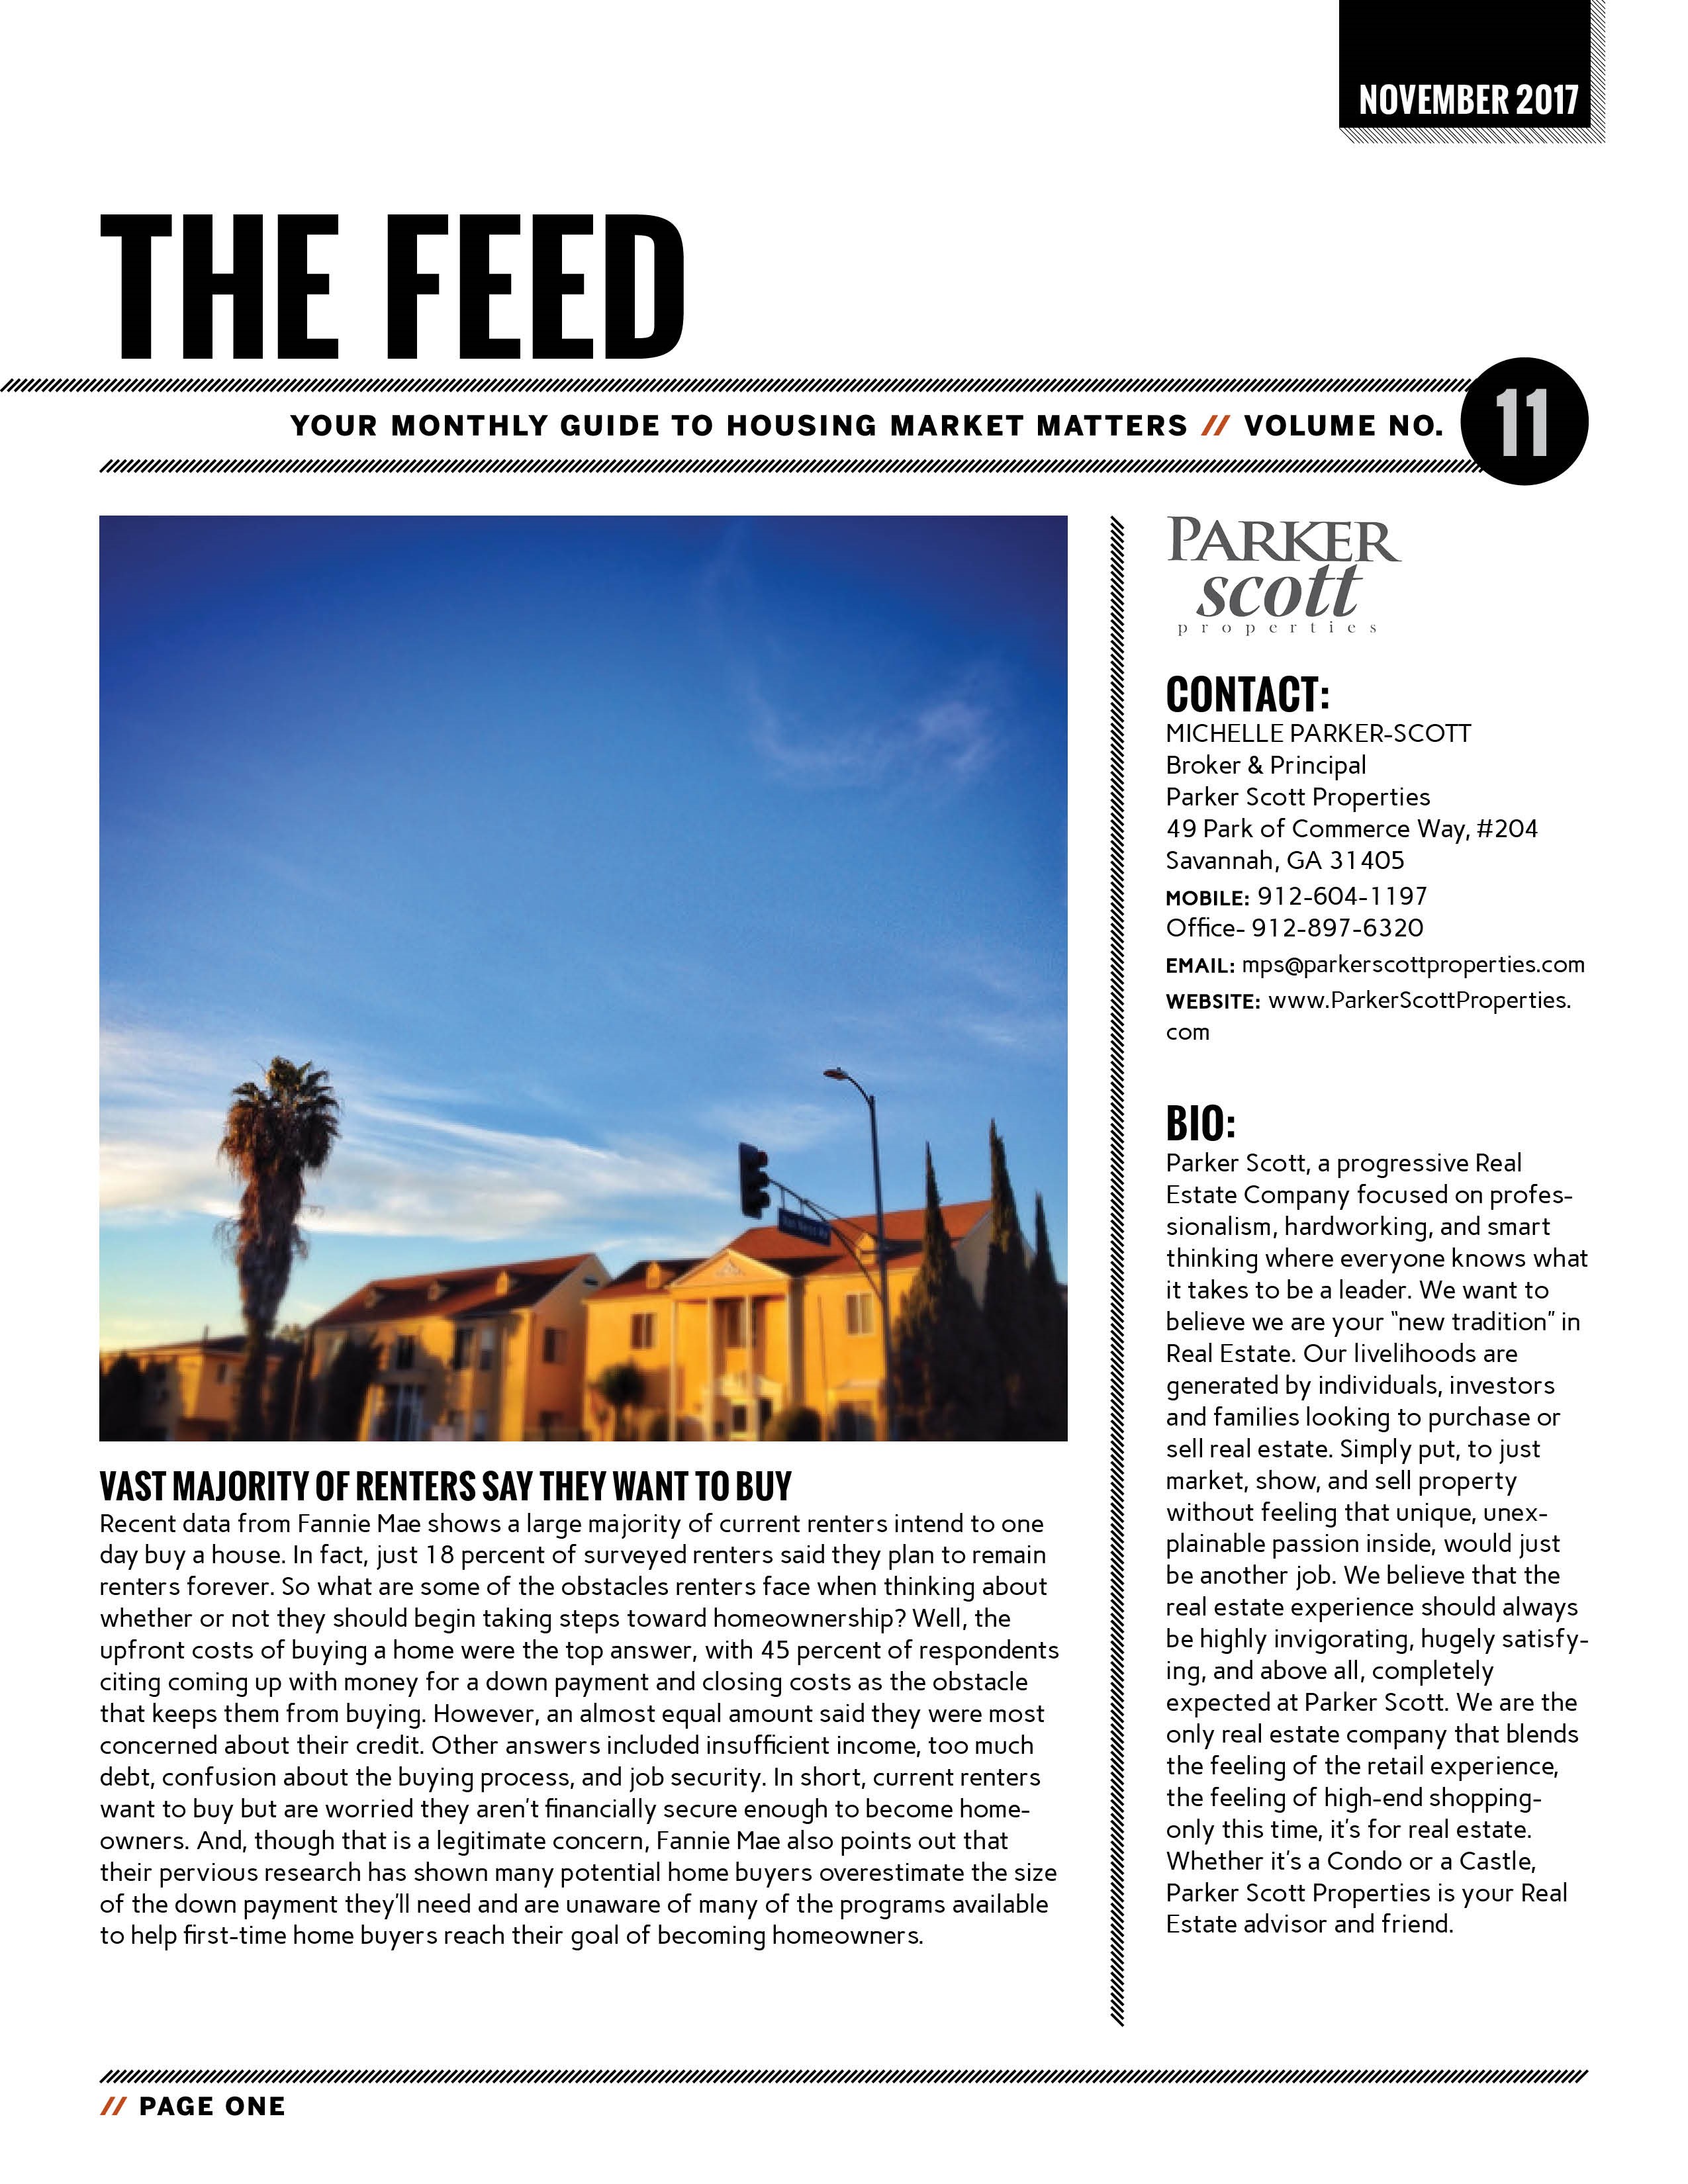
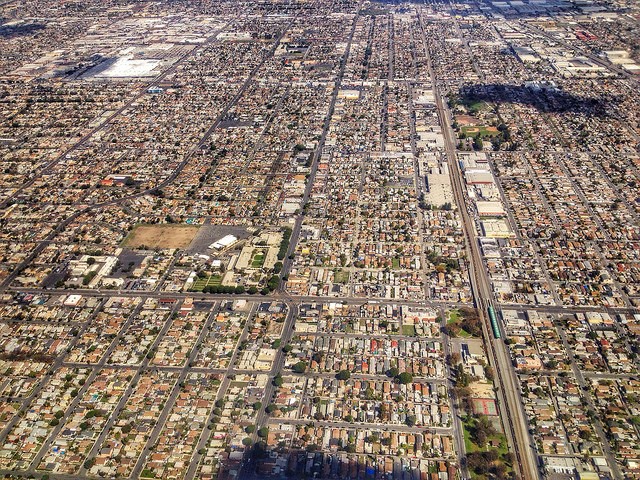
Choosing a place to live involves many different factors. From the type of kitchen you want to the school district and the commute to work, there are a lot things to take into consideration. But there are also things that you can’t possibly know, like what your prospective neighborhood will look like in 10 years. A lot can change in a decade. For that reason, LendingTree recently analyzed a number of metropolitan areas in an effort to narrow down which are changing fastest in terms of home prices, crime rates, building permits, commute times, income, rent, etc. On a scale from 1 to 100, cities were ranked in terms of how much change they underwent in particular categories between 2006 and 2016. According to the results, the most rapidly changing U.S. cities are in Texas, with Austin, Dallas, and Houston filling the top three positions on the list. Home prices were the big mover in all three cases, with each city ranking in the top five among 50 cities. The least changed cities overall included Birmingham, Ala., Milwaukee, and New Orleans. Also among the results, the top five cities for percent of residents who moved into their homes since 2010 were Las Vegas, Phoenix, Austin, Orlando, and Denver. More here.
After consecutive months of decline, sales of existing homes – including single-family homes, townhomes, condominiums, and co-ops – rose 0.7 percent in September, according to the National Association of Realtors. The improvement may have been even greater if not for lack of inventory in some markets and the effects of recent hurricanes in Texas and Florida. Lawrence Yun, NAR’s chief economist, says the fact that there are too few homes for sale has been holding the housing market back, as there has been no shortage of interested home buyers this year. “Realtors this fall continue to say the primary impediments stifling sales growth are the same as they have been all year: not enough listings – especially at the lower end of the market – and fast-rising prices that are straining the budgets of prospective buyers.” But while inventory has been an issue this year, recent data shows listings have been on the rise lately. In fact, they were up another 1.6 percent in September. And, following the busy summer sales season, competition for available homes usually begins to cool, meaning there may be good opportunities for potential home buyers who want to take advantage of improved conditions this fall. More here.
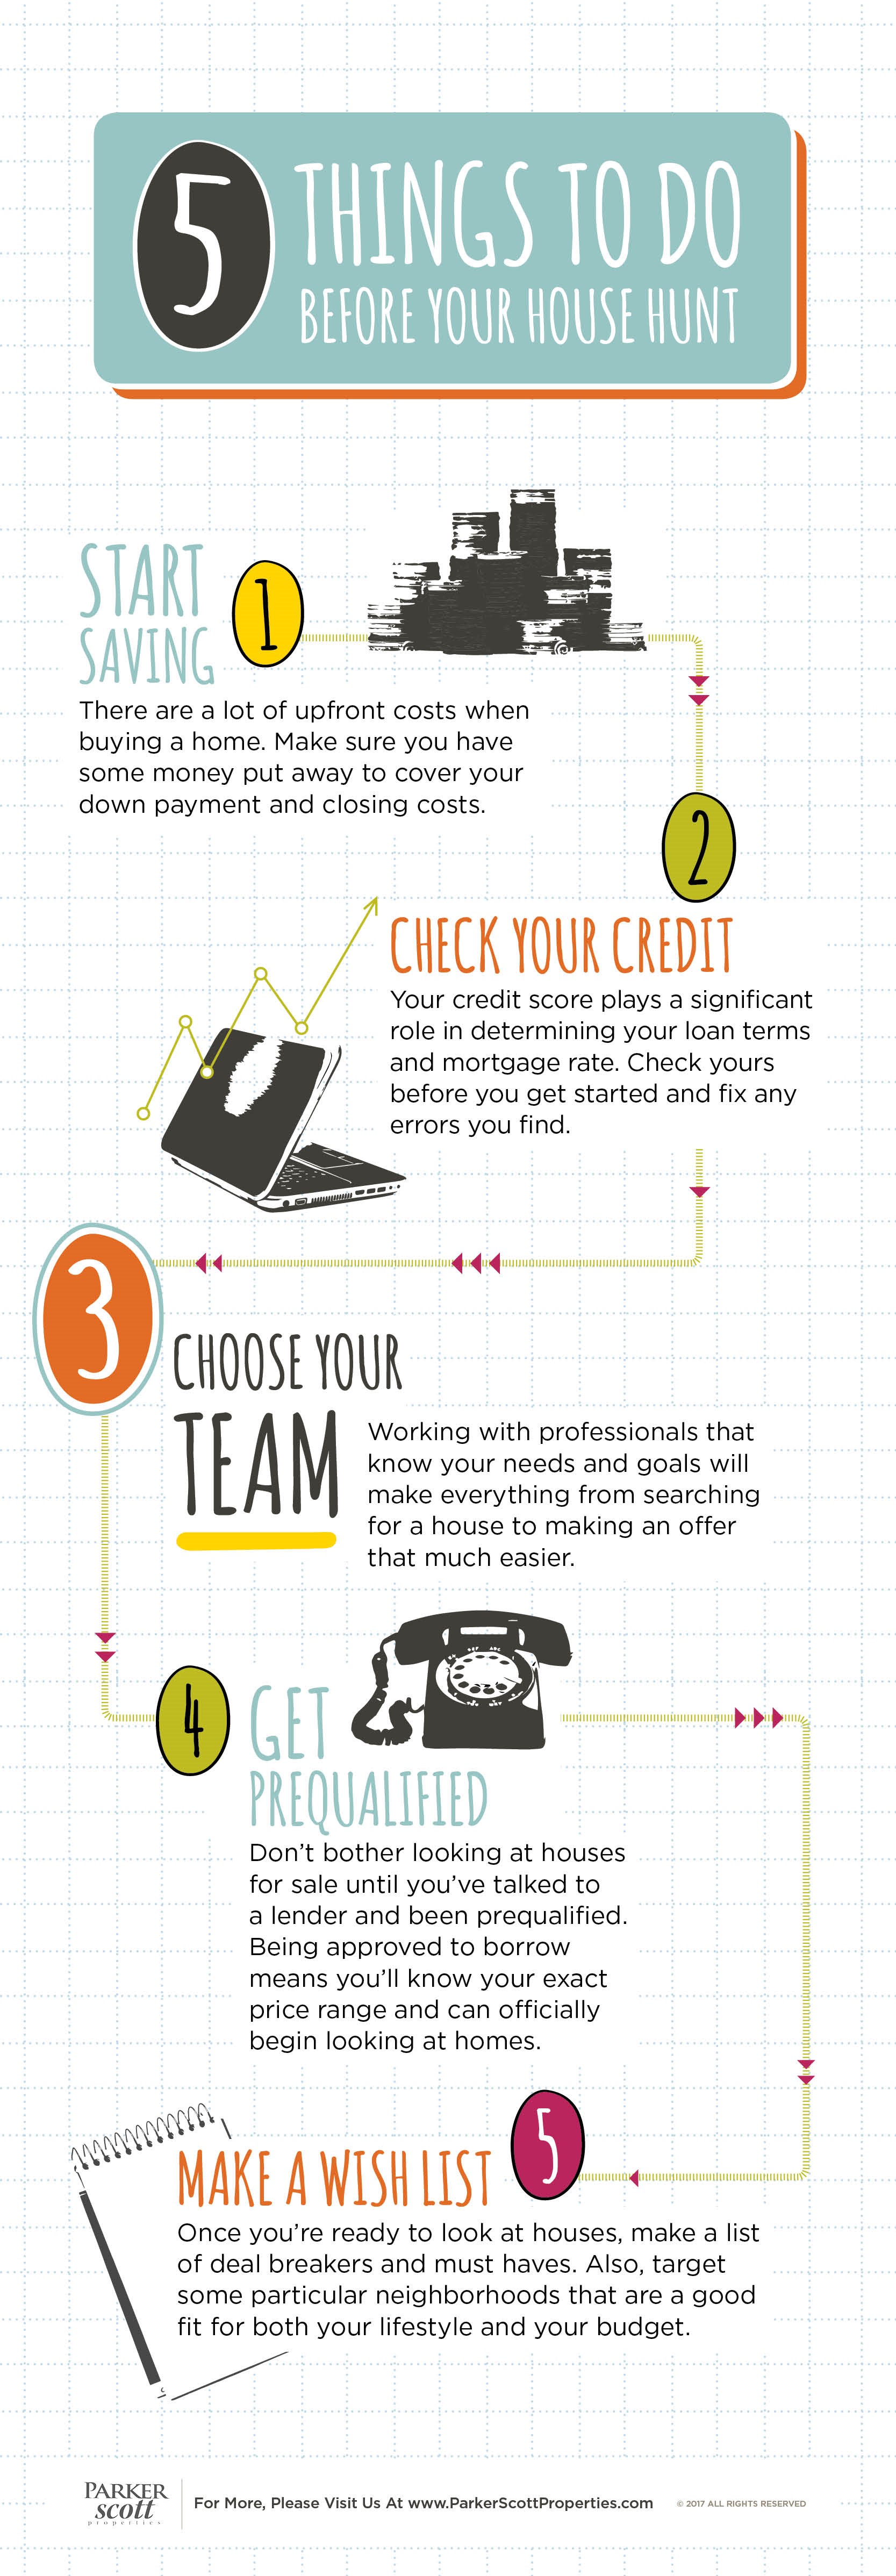
When asked, Americans overwhelmingly say they value homeownership and believe it increases financial stability. In fact, one recent survey found 93 percent of respondents said they felt that homeownership was an important part of the American dream. Still, despite their desire to buy and own a home, many Americans hesitate before pursuing their dream of becoming homeowners. And while there are many reasons for this, one of them is misconceptions about the home buying process. NeighborWorks America’s fifth annual national housing survey, for example, found a growing number of respondents who say the home buying process is confusing. According to the results, 74 percent of adults said they strongly or somewhat agree that “the home buying process is complicated.” That’s up from 67 percent last year. What accounts for the increase is anybody’s guess but it reinforces the fact that prospective buyers should make choosing a reputable lender and real estate agent among the first steps they take after deciding to buy a home. Working with experienced professionals will demystify the buying process and help you navigate the ins-and-outs of purchasing a house. More here.
The results of a new survey show Americans prefer a 10 percent down payment when buying a house. The 2017 Mortgages In America Survey found it was the most popular option among young, middle aged, and older home buyers when asked to choose among down payments up to 30 percent. And it lines up pretty well with actual data. In fact, the average down payment in 2016 was 11 percent, with borrowers under the age of 35 putting down something closer to 8 percent. But, though Americans clearly prefer it, lower down payments come with tradeoffs. For one, if you put less money down upfront, you may have to pay private mortgage insurance, which can add to your monthly mortgage payment. Which means, though home buyers have options and won’t necessarily have to put 20 percent down on the house they’re buying, it is always a good idea to save up as much as possible, so you have a substantial amount to invest in your home. It’ll make you a more attractive buyer to home sellers, in addition to helping keep your mortgage payment more affordable. More here.

If you have kids – or have ever been one yourself – you know that Halloween is an important time of year. The opportunity to amass large quantities of free candy is irresistible to most kids. Combine that with the chance to dress up in costume and parade through the streets and Halloween becomes one of the year’s most anticipated days. Because of this, Zillow ranks the best cities for trick-or-treating each year. Their rankings are based on home values, the share of population under 10 years old, and single-family home density. This year, five of the top 10 cities are in California, with San Francisco topping the list. Of course, much of that has to do with higher home values in the West, but kids in Los Angeles, Sacramento, San Jose, and Long Beach can look forward to a happy Halloween this year. Other cities that made the top 10 included Philadelphia, Baltimore, Washington D.C., Milwaukee, and Seattle. But regardless of where you are, Dr. Svenja Gudell, Zillow’s chief economist, says there’s a surefire way to tell the best local neighborhoods for trick-or-treating. “These are places we think will have plenty of candy and lots of young kids running around from door to door,” Gudell says. “If you don’t live in one of these cities, look for areas that are getting into the Halloween spirit with decorations and lots of costumed kids.” More here
Who Buys Vacation Homes And Where They Buy

Everyone, at one time or another, has dreamed of buying a vacation home. Whether it was just a temporary fantasy brought on by a particularly perfect trip or it was something more real, it’s hard not to think about the joys of owning a place in your favorite town or getaway spot. But who’s actually buying vacation homes and where are the most popular locations to have a house? Well, the National Association of Realtors collects that info each year as part of their Investment and Vacation Home Buyers Survey. This year’s results show that, among vacation home buyers, the South is the most popular area to buy. In fact, a full 47 percent of vacation homes bought last year were purchased in the South. The West came in second with 25 percent. Also, beach houses outpace all others, with sales more than doubling the number of homes purchased in the mountains, at a lake, or in the country. And who’s most likely to buy a vacation home? Not surprisingly, Lawrence Yun, NAR’s chief economist, says older buyers. “Baby boomers at or near retirement continue to propel the demand for second homes, although headwinds softened the overall volume of vacation sales last year,” Yun said. In 2015, the median household income of a vacation home buyer was $103,700 and the property they purchased was a median distance of 200 miles away from their primary home. More here.