It seems you can’t find a headline with the term “housing affordability” without the word “crisis” attached to it. That’s because some only consider the fact that residential real estate prices have continued to appreciate. However, we must realize it’s not just the price of a home that matters, but the price relative to a purchaser’s buying power.
Homes, in most cases, are purchased with a mortgage. The current mortgage rate is a major component of the affordability equation. Mortgage rates have fallen by over a full percentage point since December 2018. Another major piece of the affordability equation is a buyer’s income. The median family income has risen by 3.5% over the last year.
Let’s look at three different reports issued recently that reveal how homes are very affordable in comparison to historic numbers, and how they have become even more affordable over the past several months.
1. National Association of Realtors’ (NAR) Housing Affordability Index:
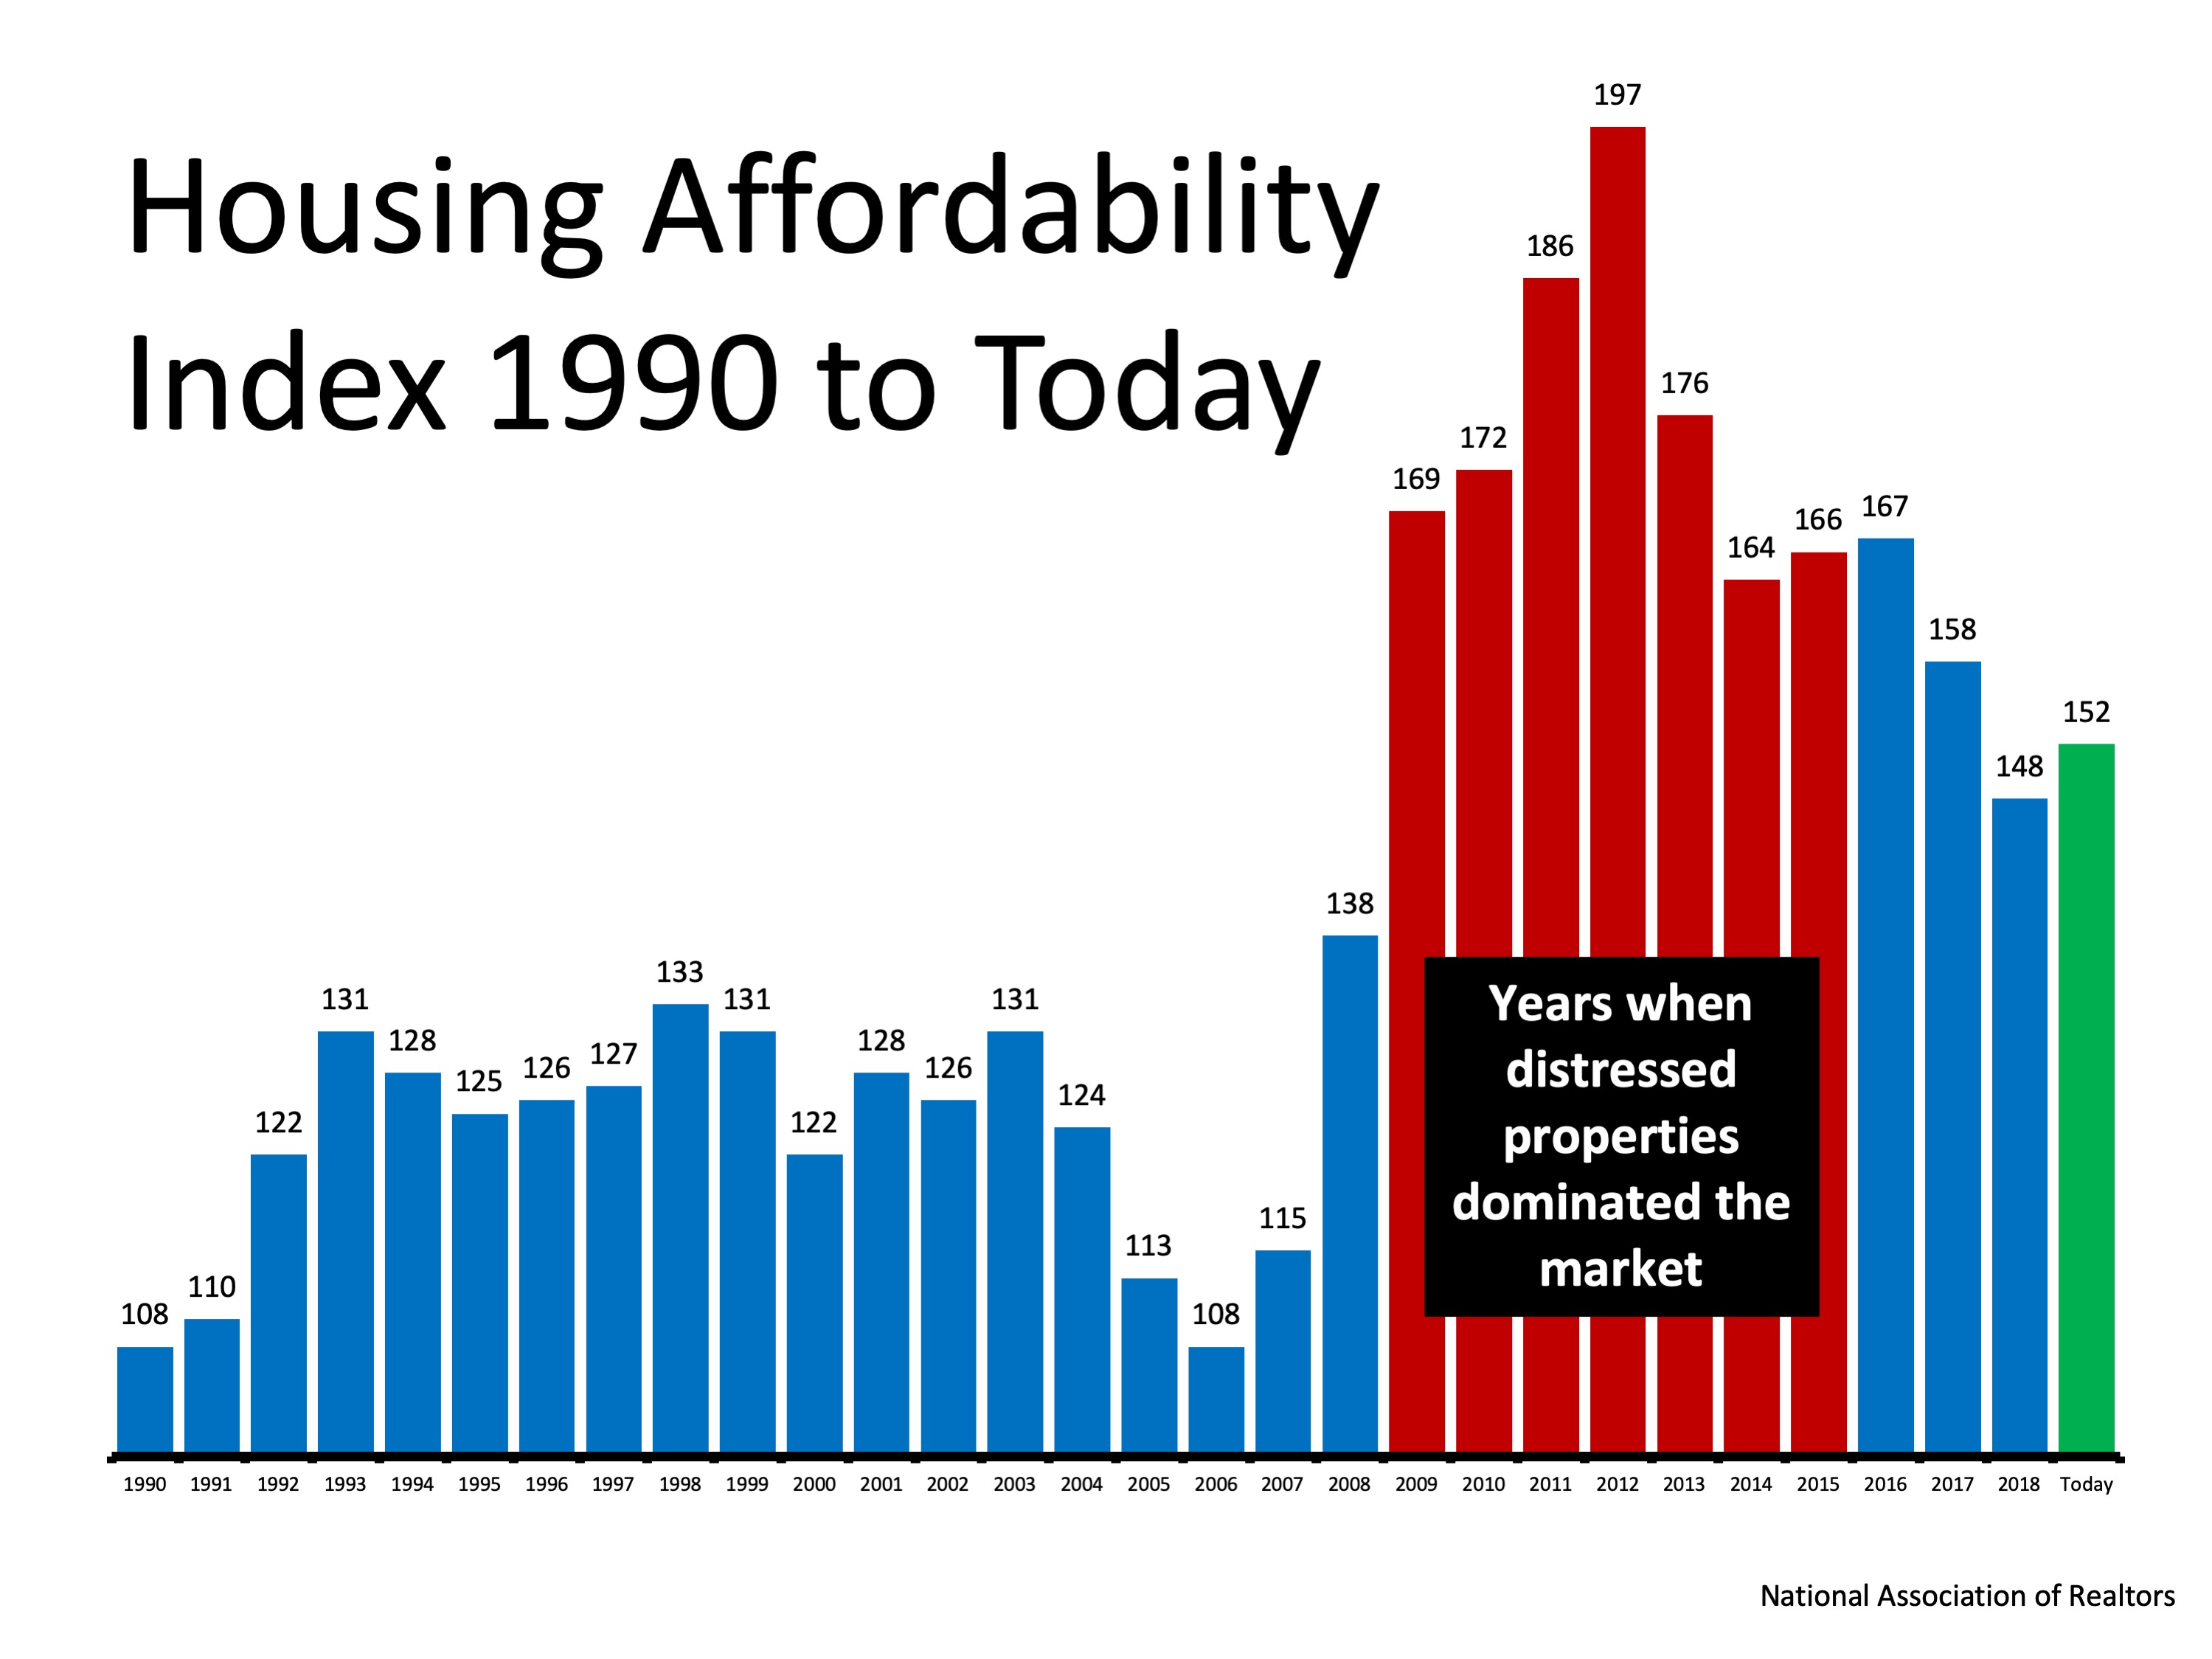
Here is a graph showing the index going all the way back to 1990. The higher the column, the more affordable homes are: We can see that homes are less affordable today (the green bar) than they were during the housing crash (the red bars). This was when distressed properties like foreclosures and short sales saturated the market and sold for massive discounts. However, homes are more affordable today than at any time from 1990 to 2008.
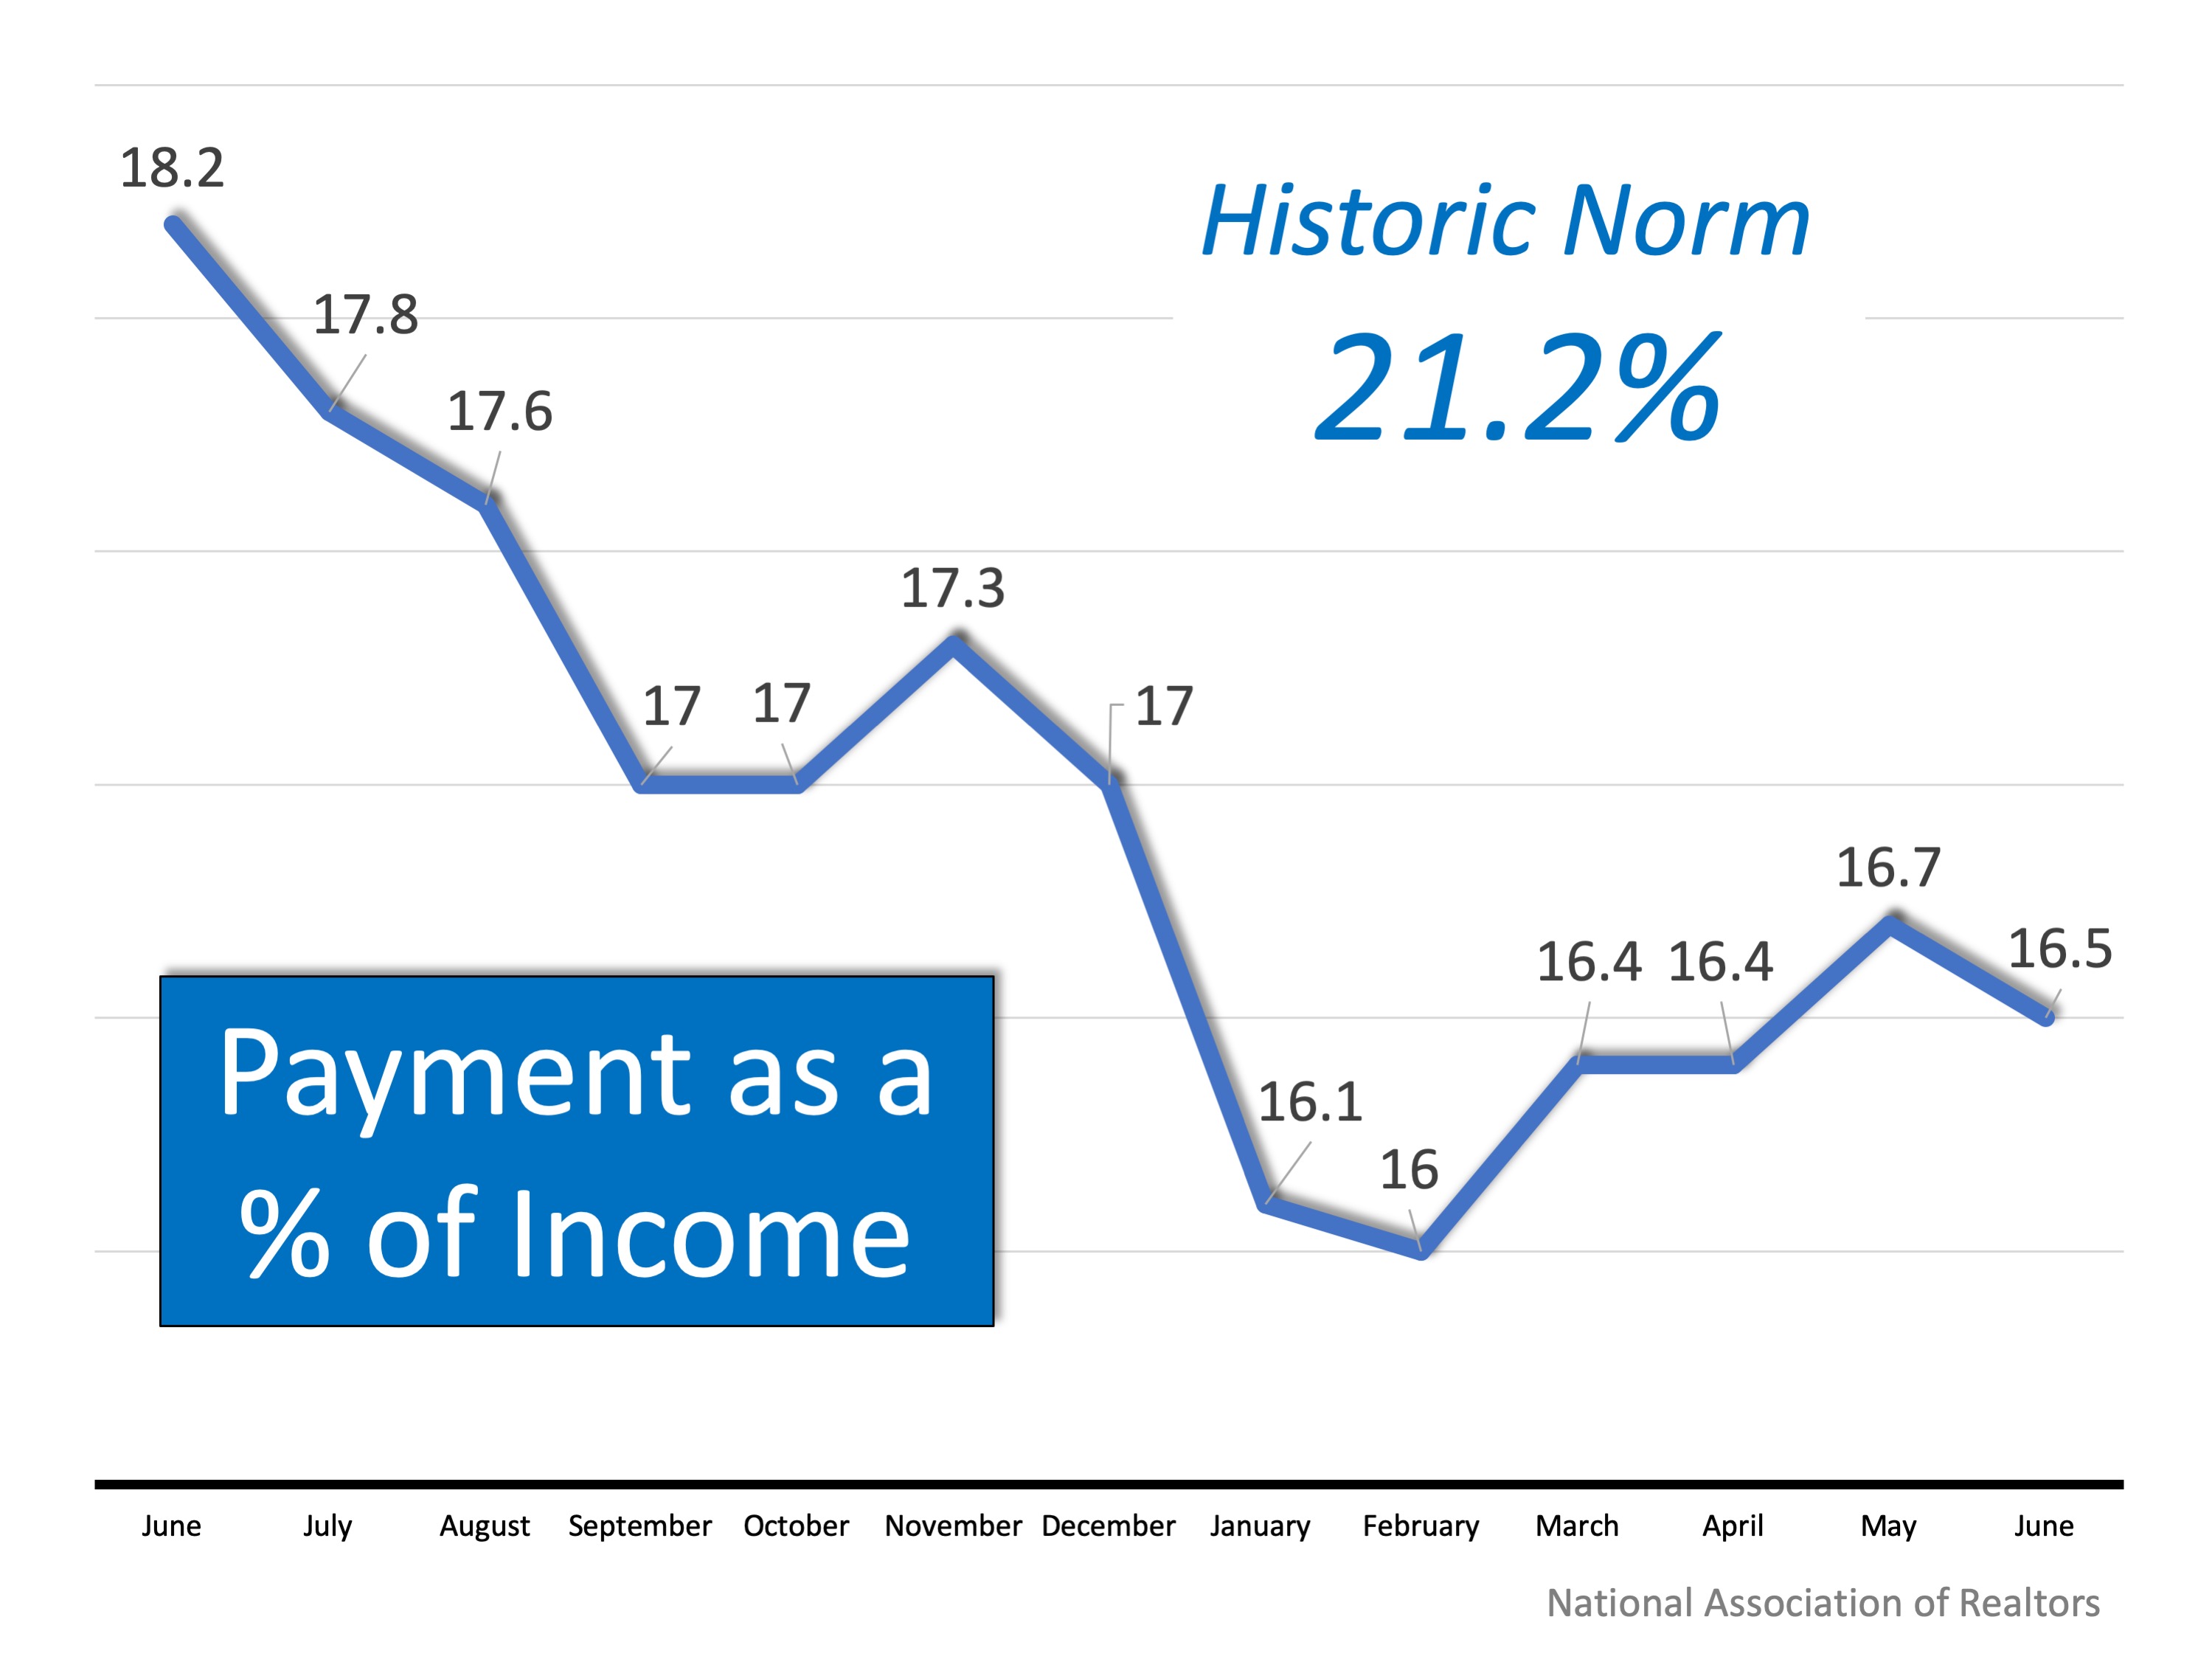
NAR’s report on the index also shows that the percentage of a family’s income needed for a mortgage payment (16.5%) is dramatically lower than last year and is well below the historic norm of 21.2%.
2. Black Knight’s Mortgage Monitor:
This report reveals that as a result of falling interest rates and slowing home price appreciation, affordability is the best it has been in 18 months. Black Knight Data & Analytics President Ben Graboske explains:
“For much of the past year and a half, affordability pressures have put a damper on home price appreciation. Indeed, the rate of annual home price growth has declined for 15 consecutive months. More recently, declining 30-year fixed interest rates have helped to ease some of those pressures, improving the affordability outlook considerably…And despite the average home price rising by more than $12K since November, today’s lower fixed interest rates have worked out to a $108 lower monthly payment…Lower rates have also increased the buying power for prospective homebuyers looking to purchase the average-priced home by the equivalent of 15%.”
3. First American’s Real House Price Index:
While affordability has increased recently, Mark Fleming, First American’s Chief Economist explains:
“If the 30-year, fixed-rate mortgage declines just a fraction more, consumer house-buying power would reach its highest level in almost 20 years.”
Fleming goes on to say that the gains in affordability are about mortgage rates and the increase in family incomes:
“Average nominal household incomes are nearly 57 percent higher today than in January 2000. Record income levels combined with mortgage rates near historic lows mean consumer house-buying power is more than 150 percent greater today than it was in January 2000.”
Bottom Line
If you’ve put off the purchase of a first home or a move-up home because of affordability concerns, you should take another look at your ability to purchase in today’s market. You may be pleasantly surprised!


