If you’re someone who is currently debating whether or not it’s a good time to sell your house, there are some new numbers from ATTOM Data Solutions that are worth taking a look at. The results of ATTOM’s Q2 2017 U.S. Home Sales Report shows that homeowners who sold their house during the second quarter of this year saw an average price gain of $51,000 over what they bought it for. That’s a 26 percent average return and the highest return since the third quarter of 2007. Daren Blomquist, ATTOM’s senior vice president, says homeowners are facing a tough choice in today’s market. “Potential home sellers in today’s market are caught in a Catch-22,” Blomquist said. “While it’s the most profitable time to sell in a decade, it’s also extremely difficult to find another home to purchase, which is helping to keep homeowners in their homes longer before selling.” That’s true. The report shows that homeowners who sold during the second quarter had owned their homes an average of 8.05 years, which is the longest homeownership tenure since the first quarter of 2000. More here.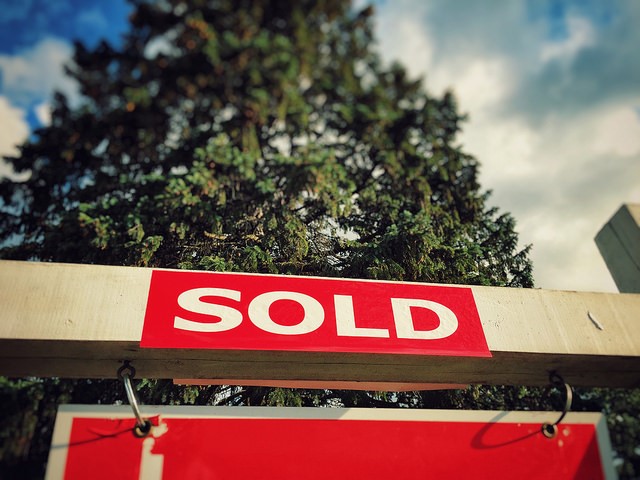
Millennials Say Having A Dog Is A Top Reason To Buy
Millennials Say Having A Dog Is A Top Reason To Buy
There are a handful of common answers that come up time and time again when Americans are surveyed about their reasons for buying a home. For example, a desire for more space is always at or near the top of any list documenting prospective buyers’ main motivations.
If you’ve run out of space where you are<!–more–>

After all, if you’ve run out of space where you are – whether it’s because you’ve started a family or because you’ve got a lot of stuff – you’re probably going to be eager to move somewhere bigger. But though survey after survey finds we all share some common wants and needs when it comes to our homes, a new survey of young Americans who have never owned a home found a surprising reason behind their desire to become homeowners.
So, what was it? Well, 42 percent of respondents said their dog, or desire to have one, was a key factor in wanting to one day buy a home of their own. And, though that may seem unusual to those of us who don’t have pets, those that do, more often than not, consider them a part of their family. So, for a renter who may have trouble finding a landlord that will allow pets at all or one that won’t charge them extra for having one, buying a home can provide a less stressful environment for both the homeowner and their beloved pet. More here.
Homeownership Rate Rises Unexpectedly
For several years following its 2004 peak, the homeownership rate was falling. Fewer Americans were buying homes and, instead, more were choosing to rent. The reasons behind this were fairly obvious.
The housing crash and financial crisis made buying a home difficult for younger Americans who were struggling to get on their feet and kept hesitant homeowners from putting their homes on the market due to lost value. The combined effect was that fewer Americans were in a position to buy and the very idea of homeownership as a wise financial decision was called into question.
Since then, though, home prices have largely bounced back and a stronger job market has led to rising buyer demand. Because of this, the homeownership has now begun to inch back up.
Homeownership Has Now Begun to Inch Back Up
For example, the latest report from the U.S. Census Bureau shows the homeownership rate improved during the second quarter of this year and is nearly one percent higher than at the same time last year. Still, at 63.7 percent, the rate is comparatively low. At its peak, it was near 70 percent. More here. 
New Home Builders Say Buyer Interest Is Strong
Buyer demand for new homes remains strong, according to the most recent Housing Market Index from the National Association of Home Builders.
The Index – which measures builders’ confidence in the new home market on a scale where any number above 50 indicates more builders view conditions as good than poor – was at 64 in July.
Additionally, individual components measuring current sales conditions and expectations over the next six months both scored 70 or above. Robert Dietz, NAHB’s chief economist, says buyer demand is strong but there are other factors slowing the rate of new home construction. “The HMI measures of currents sales conditions has been at 70 or higher for eight straight months, indicating strong demand for new homes,” Dietz said. “However, builders will need to manage some increasing supply-side costs to keep home prices competitive.” Specifically, builders have expressed concern over the cost of lumber. Naturally, higher lumber prices effect the overall cost of new homes and the number of buyers that can afford them. In other words, the reason more new homes aren’t being built isn’t because of a lack of demand and, in many cases, has more to do with higher material prices and a fewer available lots to build on. More
Today’s Homeowner Stays In One Place Longer

There are a lot of things to consider when deciding whether or not to sell your house and move. Home values, your mortgage rate, school district, plans for the future, and proximity to friends and family all play a role. In other words, after buying a house, homeowners generally stay there for a handful of years – if only to avoid uprooting their life. These days, however, Americans are staying in their homes almost 60 percent longer than they did before the housing crash. Traditionally, homeowners moved every six years or so. Now it’s closer to 10 years. Lawrence Yun, the National Association of Realtors’ chief economist, recently told a meeting of real estate agents in Florida that sellers are staying in their homes for longer periods of time and, it may be holding the housing market back. But why would Americans be less likely to move now than they were a decade ago? For one, historically low mortgage rates. Homeowners that were able to refinance over the past few years, may be reluctant to risk losing their low rate. In other instances, people whose homes lost value during the last recession may have stayed in their current homes in hopes of selling once prices rebounded. All in all, it’s expected that there will be an increasing number of Americans looking to sell their home in the near future and, when that happens, the influx of for-sale inventory will help moderate prices and give buyers more choices when looking for a house to call home. More here.
Home Sales Hit Highest Pace In A Decade
Autumn may typically be the time of year when home sales start to slow down but new numbers show sales of previously owned homes up for the second straight month and at their highest annual pace since February 2007. The data, from the National Association of Realtors, shows October sales up 2 percent over the month before and 5.9 percent above last year’s estimate. Lawrence Yun, NAR’s chief economist, says the past two months have been an autumn revival for the housing market. “October’s strong sales gain was widespread throughout the country and can be attributed to the release of the unrealized pent-up demand that held back many would-be buyers over the summer because of tight supply,” Yun said. “The good news is that the tightening labor market is beginning to push up wages and the economy has lately shown signs of greater expansion. These two factors and low mortgage rates have kept buyer interest at an elevated level so far this fall.” Sales were up in all regions, with the largest gains in the South, where home sales rose 2.8 percent. Also in the report, the typical home stayed on the market for 41 days in October, though 43 percent of homes sold in less than a month. More here.
Rising Number Of Homeowners Are Equity Rich
Rising Number Of Homeowners Are Equity Rich
Equity rich may not be a phrase you’re familiar with but it refers to homeowners whose loan-to-value ratio is 50 percent or lower – meaning homeowners whose mortgage is less than half of their home’s appraised value. Simply put, a homeowner’s loan-to-value ratio refers to the amount of their home’s value that is borrowed. For example, if you were buying a house valued at $100,000 but only borrowing $50,000 to purchase it, your loan-to-value ratio would be 50 percent.

Rising Number Of
Homeowners Are Equity Rich
Naturally, the lower a homeowner’s ratio, the more equity that homeowner has. A recent report from ATTOM Data Solutions looked at homeowners across the country and found 23.4 percent of all homeowners with a mortgage were equity rich, an increase of more than 2.6 million from the same time last year. Daren Blomquist, senior vice president at ATTOM, says the combination of people living in one place for longer periods and continued home price increases have led to the improvement. “Median home prices increased on a year-over-year basis for the 18th consecutive quarter in Q3 2016, and homeowners who sold in the third quarter had owned their home an average of 7.94 years – a new high in our data and substantially higher than the average homeownership tenure of 4.26 years pre-recession,” Blomquist said. More here.
What You Need To Know About Home Prices
Home Sales Prices
What You Need To Know About Home Prices
Whether you’re looking to buy a home or condo in the Savannah area or you’re ready to sell a home or condo in the Savannah area, home prices are likely a topic of great interest to you. For this reason, a couple of new reports deserve a closer look.
First, ATTOM Data Solutions just released their U.S. Home Sales Report for the third quarter. Among the results, the data shows that the median home price has now surpassed its pre-recession peak and is at an all-time high. In fact, the median price in the third quarter hit $230,000 – which is 1 percent higher than its previous peak of $227,000 in 2005. But though that sounds like bad news for buyers, there may be more to the story. That’s because another recent report shows that – though home prices continue to rise – in the Savannah area and elsewhere – so does the number of price reductions. That means, more sellers are adjusting their price after originally listing their house.
Whether this is because home sellers have just priced their property too high to begin with or are in markets where prices may have peaked is debatable. However, 70 of the largest 100 metropolitan areas saw an increase in price reductions. Of course, home price trends can vary from one location to the next. For example, ATTOM’s chief economist, Darren Blomquist, points out that, while prices have hit new peaks in some markets, there are also still markets where there are a high number of distressed properties and opportunities for buyers looking for a bargain. More here.
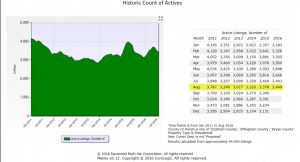
Studies from the Savannah Multi-list Corporation Combined Residential Sales Report for Bryan County, Chatham County and Effingham County, From January 2011 thru August 2016 with the results calculated from approximate 44,000 listings, not including new construction showed the monthly active listing per month in August 2016 on average have been 3,300 per month.
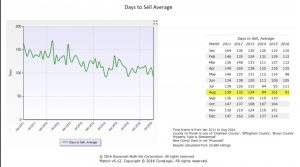
The average number of days on the market to sell, from August of 2011 at 139 days has declined in August of 2016 to 91 days on average.
Results calculated from 631 listings, not including proposed new construction, show the sales volumes of the top 20 zip codes from August of 2016; the Savannah southside area zip code 31419 sales volume was the highest with $25,728,812, the Richmond Hill Bryan County area zip code 31324 came in second with an estimated sales volume of $22,729,730, and the third zip code was the downtown area zip code 31401 with a sales volume of $14,721,575. The following seventeen zip codes may be seen on the chart below.
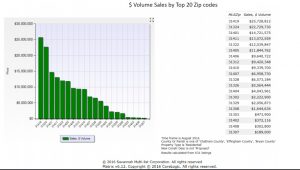
Savannah Area Volume Sales by top 20 Zip Codes
Average Report
January 2011 – August 2016
Based on the Savannah Multi-List Corporation Report, the Home Sales Price Per Square Foot Ratio for homes in the Bryan County, Chatham County and Effingham County from January 2011 thru August 2016 have continued to rise. In August of 2011 the home sales price per square foot ratio for homes in these areas were $104 per sqft, in August of 2012 the prices dropped to $99 per sqft, the following August of 2013 we saw an increase in the Savannah and surrounding areas with $108 per sqft, prices continued to rise in 2015 at $116 per sqft and this year in 2016 we saw a larger gain at $124 per sqft on average.
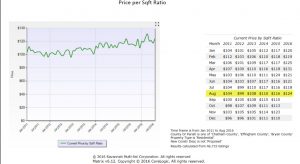
Savannah Area
Home Sales Price Per Square Foot Ratio Report
January 2011 – August 2016
Comparing Home Prices To The Stock Market

Comparing Home Prices To The Stock Market
Because they are the two markets Americans are most likely to invest in, the stock market and housing market are often compared. Analysts and economists will break down the numbers in an effort to decipher which is the better long-term bet for your bottom line. Most recently, David M. Blitzer, managing director and chairman of the index committee at S&P Dow Jones Indices, took a look at the past several years and compared home price increases and the stock market rebound. “Since the last recession ended in June 2009, the stock market as measured by the S&P 500 rose 136 percent to the end of August while home prices are up 23 percent,” Blitzer said. “However, home prices did not reach bottom until February 2012, almost three years later. Using the 2012 date as the starting point, home prices are up 38 percent compared to 59 percent for stocks.” But, though stock market gains have outpaced price appreciation, real estate has an edge when comparing total value. In fact, Blitzer notes that Americans’ homes are valued at around $22.3 trillion, while the value of stocks and mutual funds is $21.2 trillion. More here.
Most Homes Will Last More Than 100 Years
Most Homes Will Last More Than 100 Years
Everybody knows buying a house is a long-term commitment. After all, the typical mortgage is paid over 30 years and the typical home seller has been in their home for almost 10 years. In other words, homeownership isn’t for frequent movers or anyone with a strong case of wanderlust. But regardless of how long you stay in one place, you aren’t likely to outlast your house. That’s because most homes will last around 100 years, according to a new analysis from the National Association of Home Builders of numbers from the Department of Housing and Urban Development. In fact, just 0.59 percent of all housing units are lost each year. These homes are lost for various reasons – including demolition, disaster, conversions, mergers, and homes that are put to non-residential uses. And that rate is pretty consistent whether the home was built in 1983 or 1962. In fact, when broken down per decade, the annual loss rate is fairly steady, though it does accelerate to just over 1 percent for homes built before 1950. Overall, the data suggests most of the homes built recently will still be standing 100 years from now and, even if you bought a house built 40 years ago, it’ll likely still be standing strong in 2076. More here.

Most Homes Will Last More Than 100 Years