The National Association of Realtors’ Profile of Home Buyers and Sellers takes an annual look at the who, what, where, and how of the year’s typical real-estate transaction. Based on a survey sent out across the country, the results reveal things like how much the average home seller made on the sale of their home, how buyers came up with their down payment, and what types of homes sold, who sold them, and for how much. For example, last year’s typical seller was 54 years old, had been living in their home for 10 years, and had a median income of $100,700.
The most commonly cited reason for selling a home was to find something bigger, which was named by 18 percent of respondents. Other common reasons for selling a home included wanting to live closer to friends and family and because of a new job. The majority of sellers didn’t have to offer any incentives in order to attract a buyer for their home and nearly 9 in 10 used a real-estate agent to help sell their house. The typical home seller was able to sell their home for $43,100 more than they purchased it for and got 98 percent of their final listing price. More here.
Autumn may typically be the time of year when home sales start to slow down but new numbers show sales of previously owned homes up for the second straight month and at their highest annual pace since February 2007. The data, from the National Association of Realtors, shows October sales up 2 percent over the month before and 5.9 percent above last year’s estimate. Lawrence Yun, NAR’s chief economist, says the past two months have been an autumn revival for the housing market. “October’s strong sales gain was widespread throughout the country and can be attributed to the release of the unrealized pent-up demand that held back many would-be buyers over the summer because of tight supply,” Yun said. “The good news is that the tightening labor market is beginning to push up wages and the economy has lately shown signs of greater expansion. These two factors and low mortgage rates have kept buyer interest at an elevated level so far this fall.” Sales were up in all regions, with the largest gains in the South, where home sales rose 2.8 percent. Also in the report, the typical home stayed on the market for 41 days in October, though 43 percent of homes sold in less than a month. More here.
Whether you’re looking to buy a home or condo in the Savannah area or you’re ready to sell a home or condo in the Savannah area, home prices are likely a topic of great interest to you. For this reason, a couple of new reports deserve a closer look.
First, ATTOM Data Solutions just released their U.S. Home Sales Report for the third quarter. Among the results, the data shows that the median home price has now surpassed its pre-recession peak and is at an all-time high. In fact, the median price in the third quarter hit $230,000 – which is 1 percent higher than its previous peak of $227,000 in 2005. But though that sounds like bad news for buyers, there may be more to the story. That’s because another recent report shows that – though home prices continue to rise – in the Savannah area and elsewhere – so does the number of price reductions. That means, more sellers are adjusting their price after originally listing their house.
Whether this is because home sellers have just priced their property too high to begin with or are in markets where prices may have peaked is debatable. However, 70 of the largest 100 metropolitan areas saw an increase in price reductions. Of course, home price trends can vary from one location to the next. For example, ATTOM’s chief economist, Darren Blomquist, points out that, while prices have hit new peaks in some markets, there are also still markets where there are a high number of distressed properties and opportunities for buyers looking for a bargain. More here.
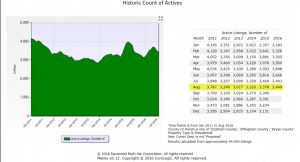
Studies from the Savannah Multi-list Corporation Combined Residential Sales Report for Bryan County, Chatham County and Effingham County, From January 2011 thru August 2016 with the results calculated from approximate 44,000 listings, not including new construction showed the monthly active listing per month in August 2016 on average have been 3,300 per month.
Savannah Multi-List Corporation Historic Count Activities Average Report January 2011 – August 2016
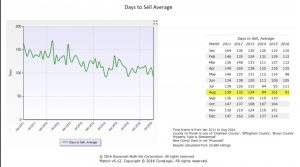
The average number of days on the market to sell, from August of 2011 at 139 days has declined in August of 2016 to 91 days on average.
Savannah Multi-List Corporation
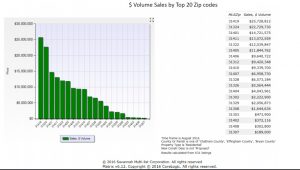
Results calculated from 631 listings, not including proposed new construction, show the sales volumes of the top 20 zip codes from August of 2016; the Savannah southside area zip code 31419 sales volume was the highest with $25,728,812, the Richmond Hill Bryan County area zip code 31324 came in second with an estimated sales volume of $22,729,730, and the third zip code was the downtown area zip code 31401 with a sales volume of $14,721,575. The following seventeen zip codes may be seen on the chart below.
Savannah Multi-List Corporation Savannah Area Volume Sales by top 20 Zip Codes Average Report January 2011 – August 2016
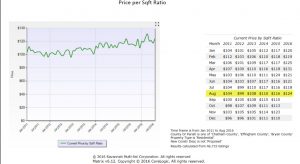
Based on the Savannah Multi-List Corporation Report, the Home Sales Price Per Square Foot Ratio for homes in the Bryan County, Chatham County and Effingham County from January 2011 thru August 2016 have continued to rise. In August of 2011 the home sales price per square foot ratio for homes in these areas were $104 per sqft, in August of 2012 the prices dropped to $99 per sqft, the following August of 2013 we saw an increase in the Savannah and surrounding areas with $108 per sqft, prices continued to rise in 2015 at $116 per sqft and this year in 2016 we saw a larger gain at $124 per sqft on average.
Savannah Multi-List Corporation Savannah Area Home Sales Price Per Square Foot Ratio Report January 2011 – August 2016
In September, new home sales were 29.8 percent higher than they were at the same time last year, according to new numbers from the U.S. Census Bureau and the Department of Housing and Urban Development. The data shows sales up 3.1 percent from the month before and at their second-highest level since the recovery began. That’s good news for the housing market because any increase in new home sales helps spur more new home construction, which raises for-sale inventory and moderates price increases on all homes up for sale. As it is, the median price of a new home sold in September was $313,500; the average sales price was $377,700. And, with the number of new homes for sale lower than the month before, prices will likely continue to rise in the near term. Still a more favorable labor market and low mortgage rates have helped balance higher prices and kept buyer demand high. As an example, economists and analysts predicted a sales decline for September, making the results both unexpected and a good indication that potential home buyers aren’t being deterred by higher prices. More here.