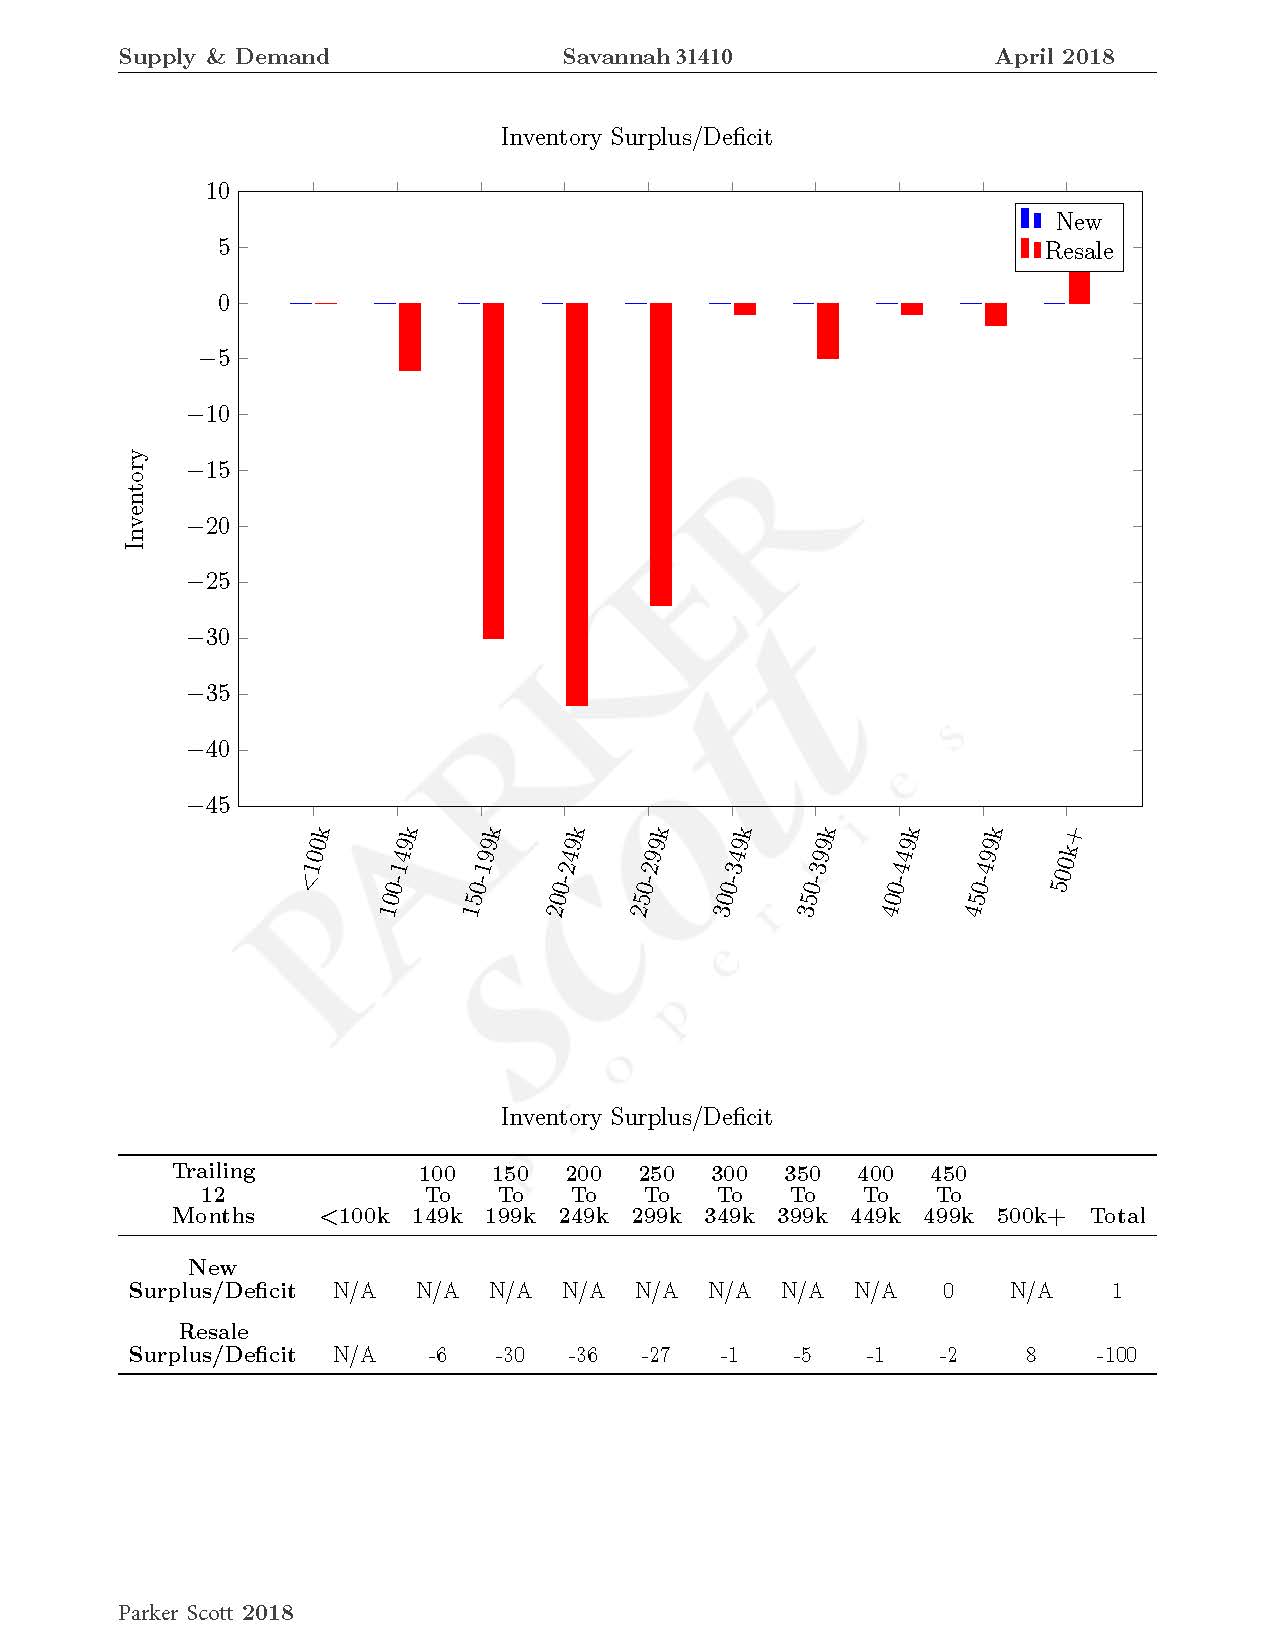
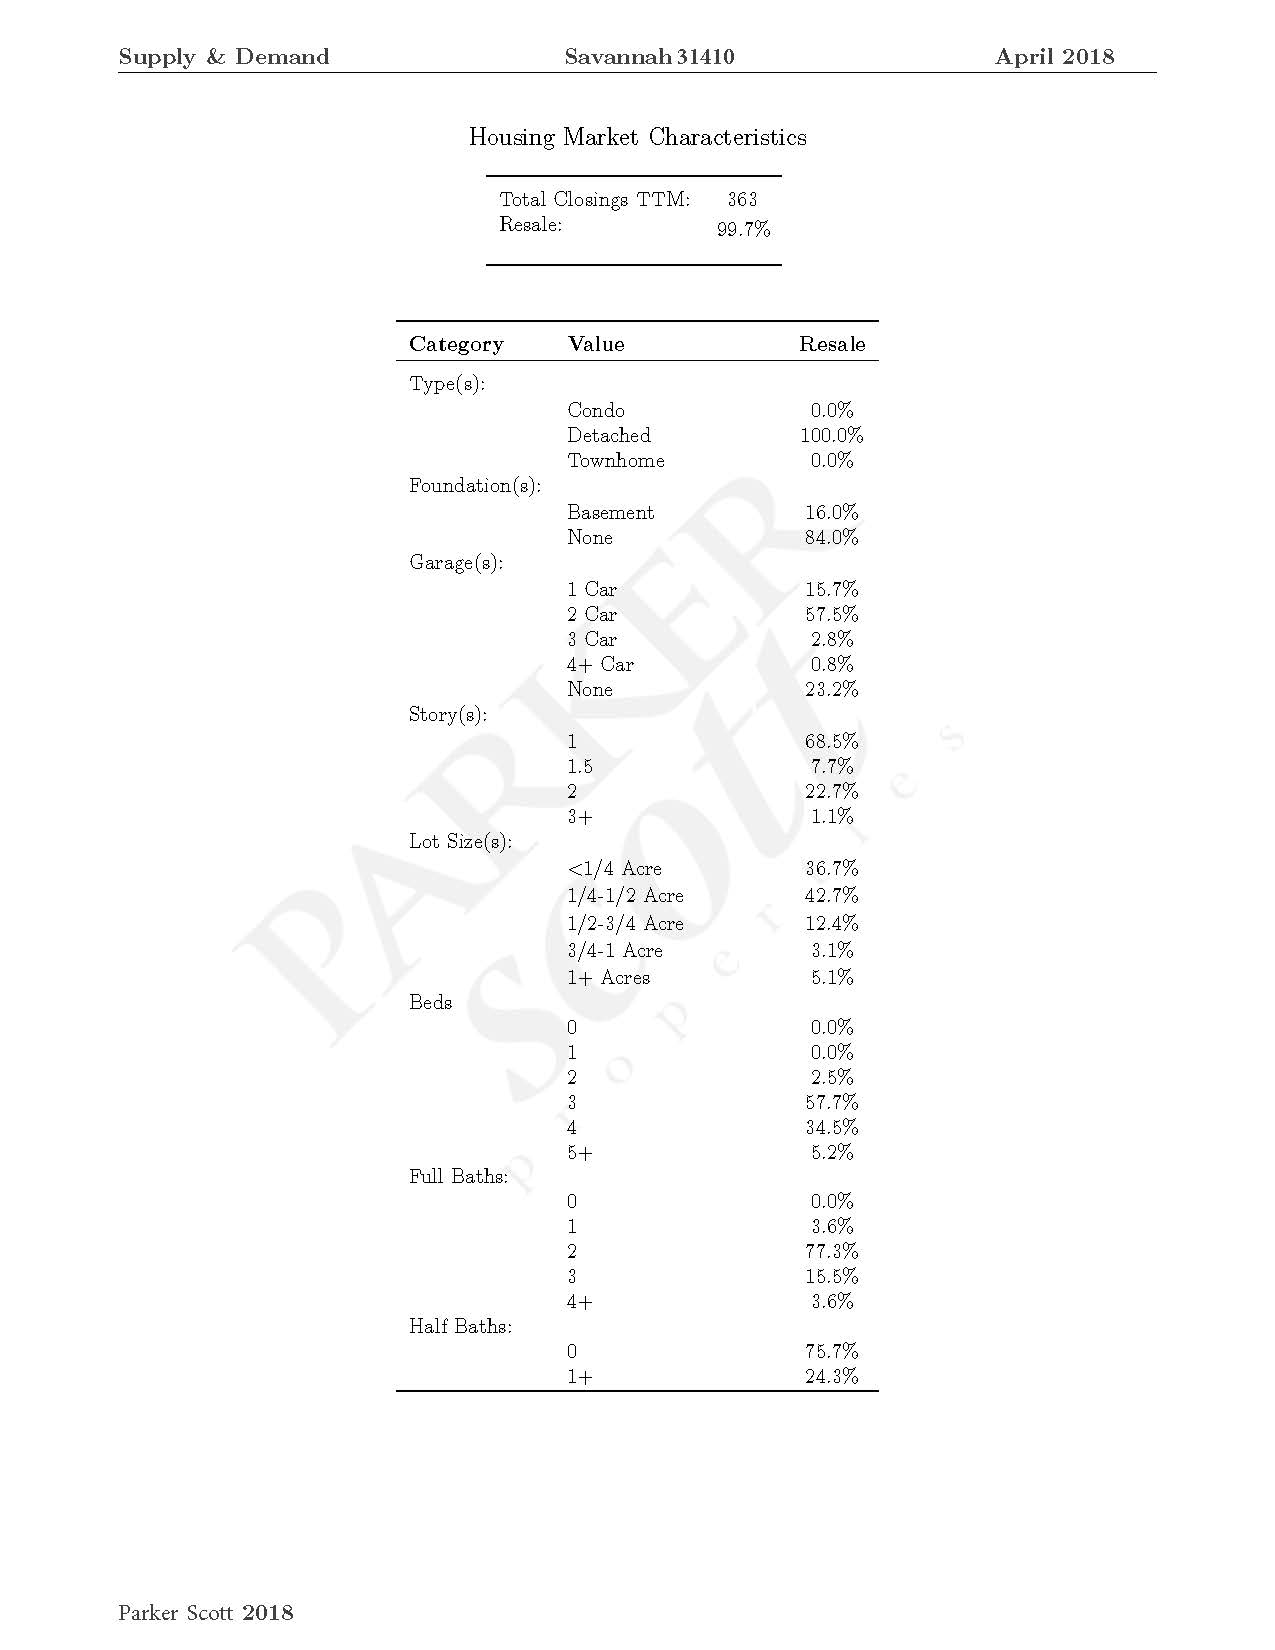
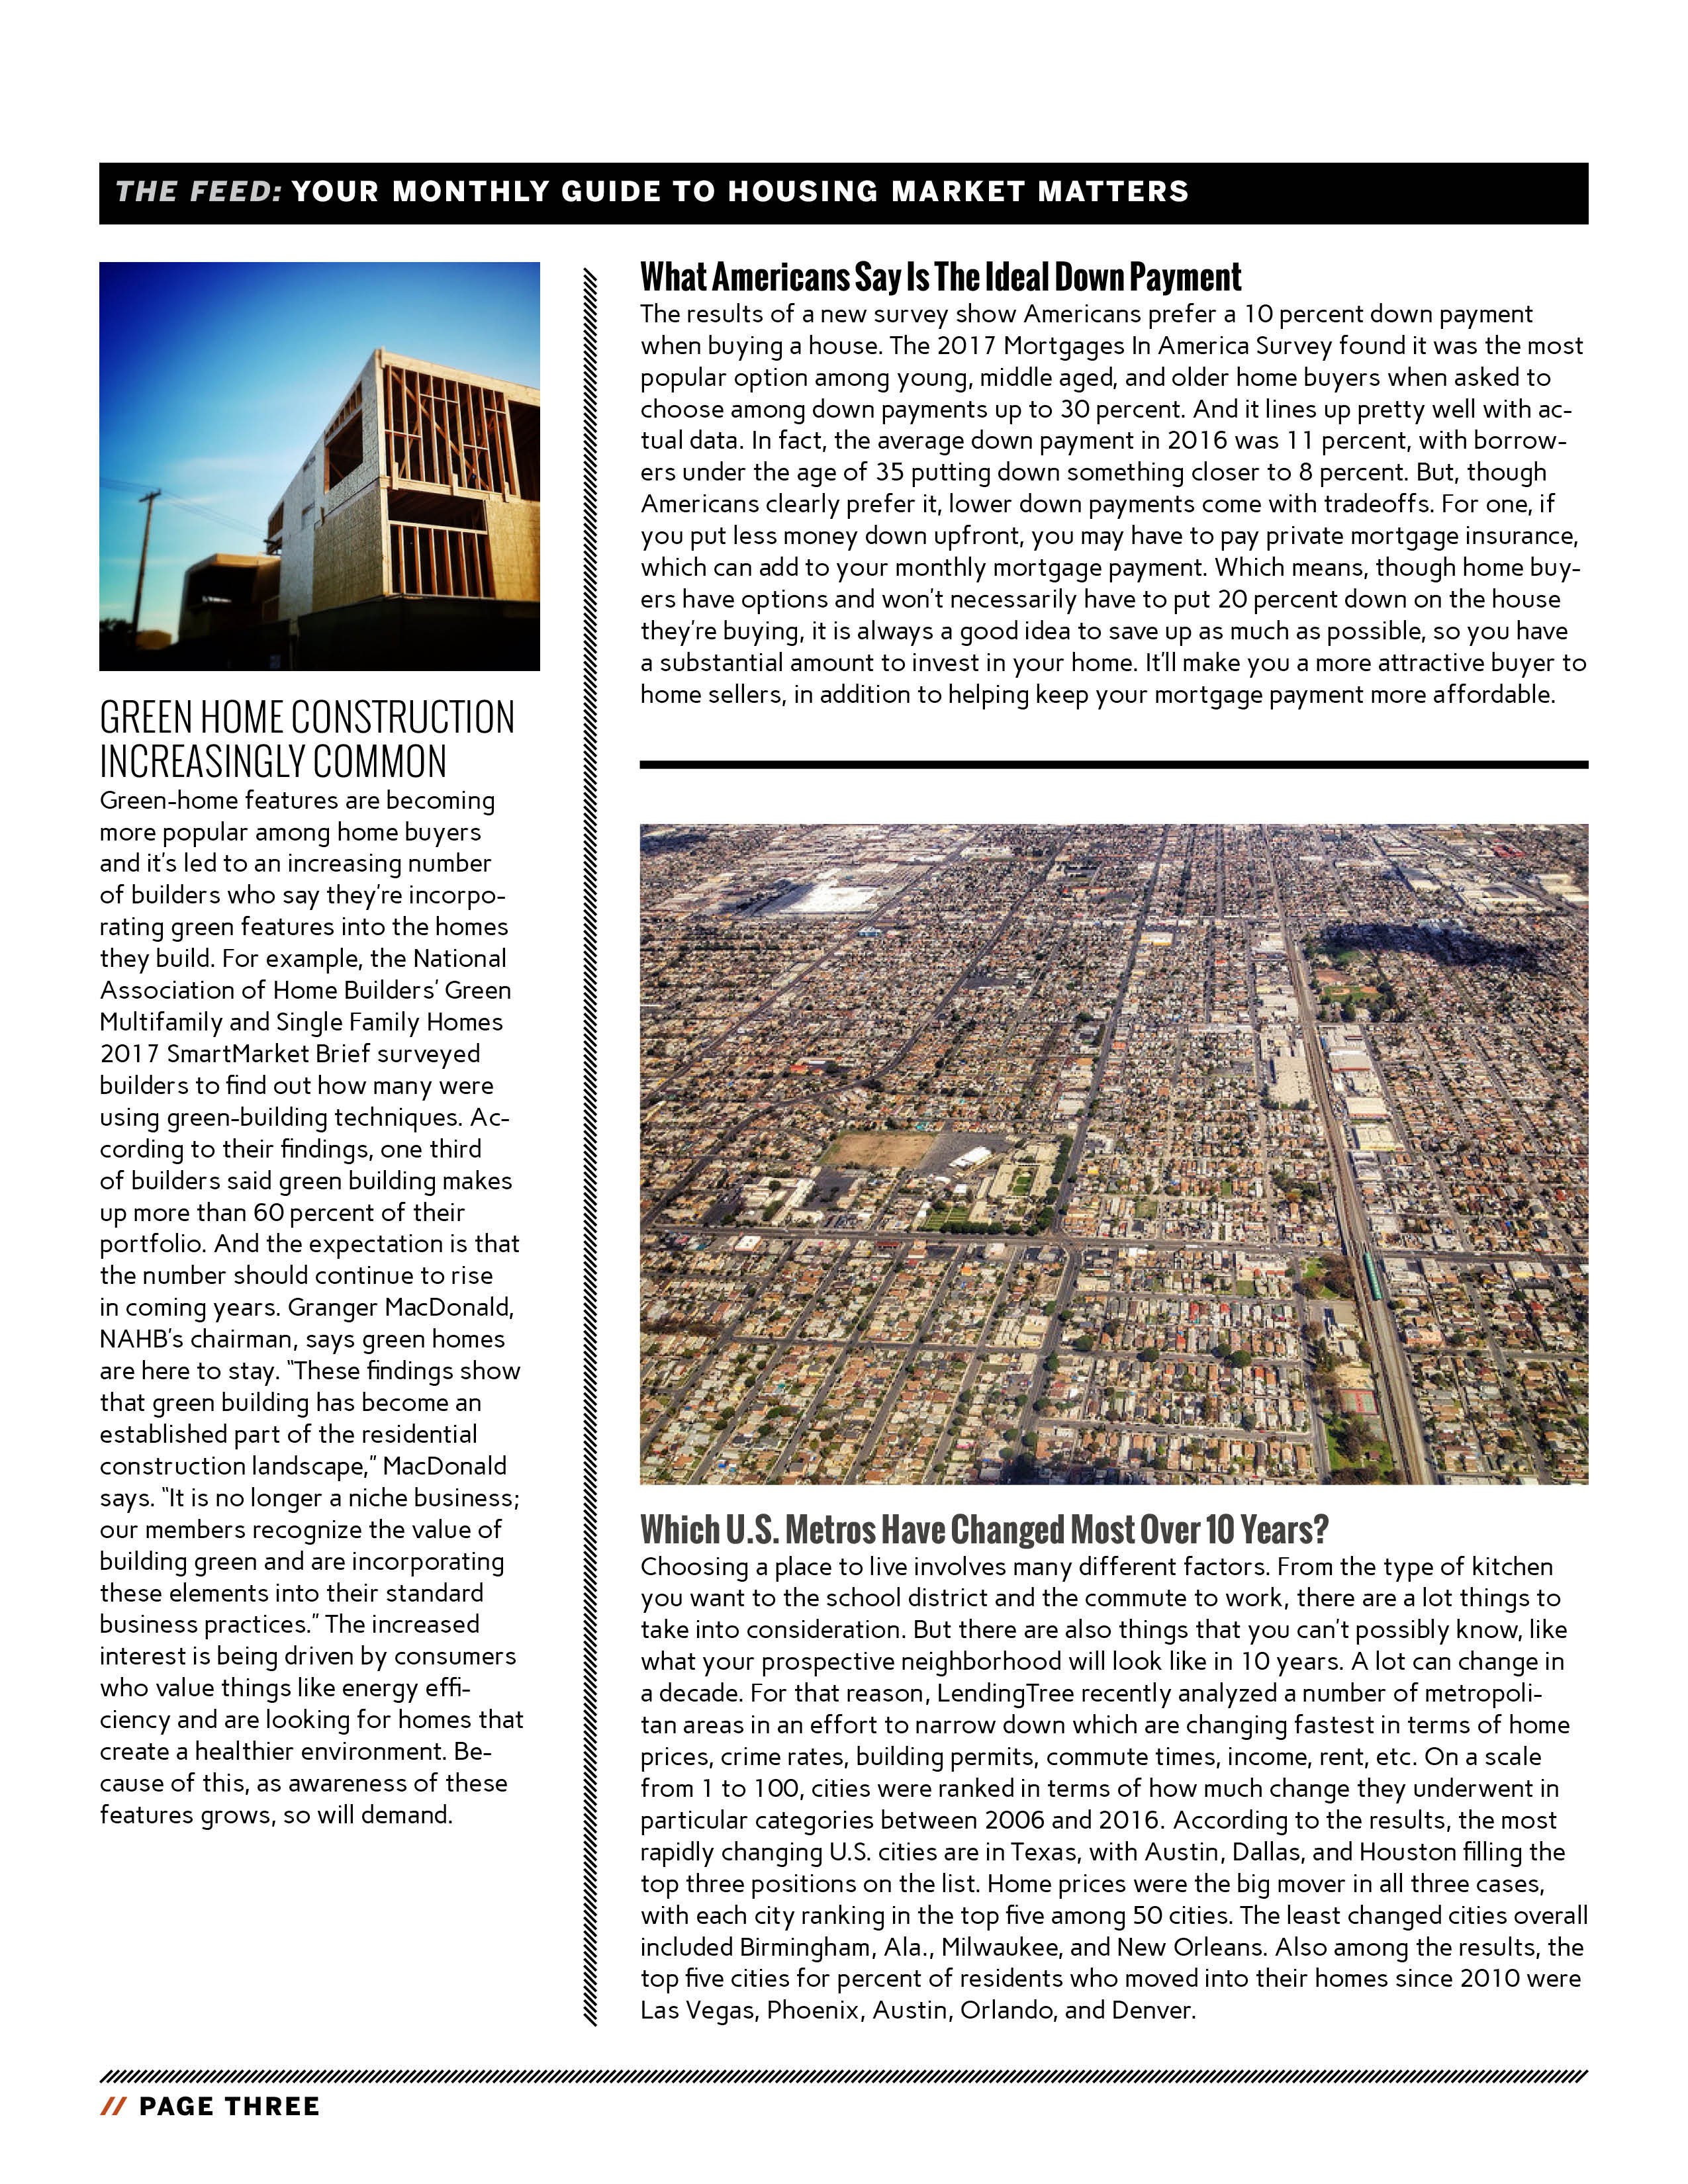
Report is based on single-family resale properties, that are detached homes (condos and townhomes not included in report). With a minimum price of $100,000 up to a maximum price of $500,000.
GARAGES
15.7% of the homes sold had 1 car garages, 57.5% had 2 car garages, 2.8% had 3 car garages, less than 1% had 4 car garages and 21% did not have a garage.
BEDROOMS
2.5% had two bedrooms, 57.7% with three bedrooms, 34.5% with four bedrooms and 3.6% had more than 4 bedrooms
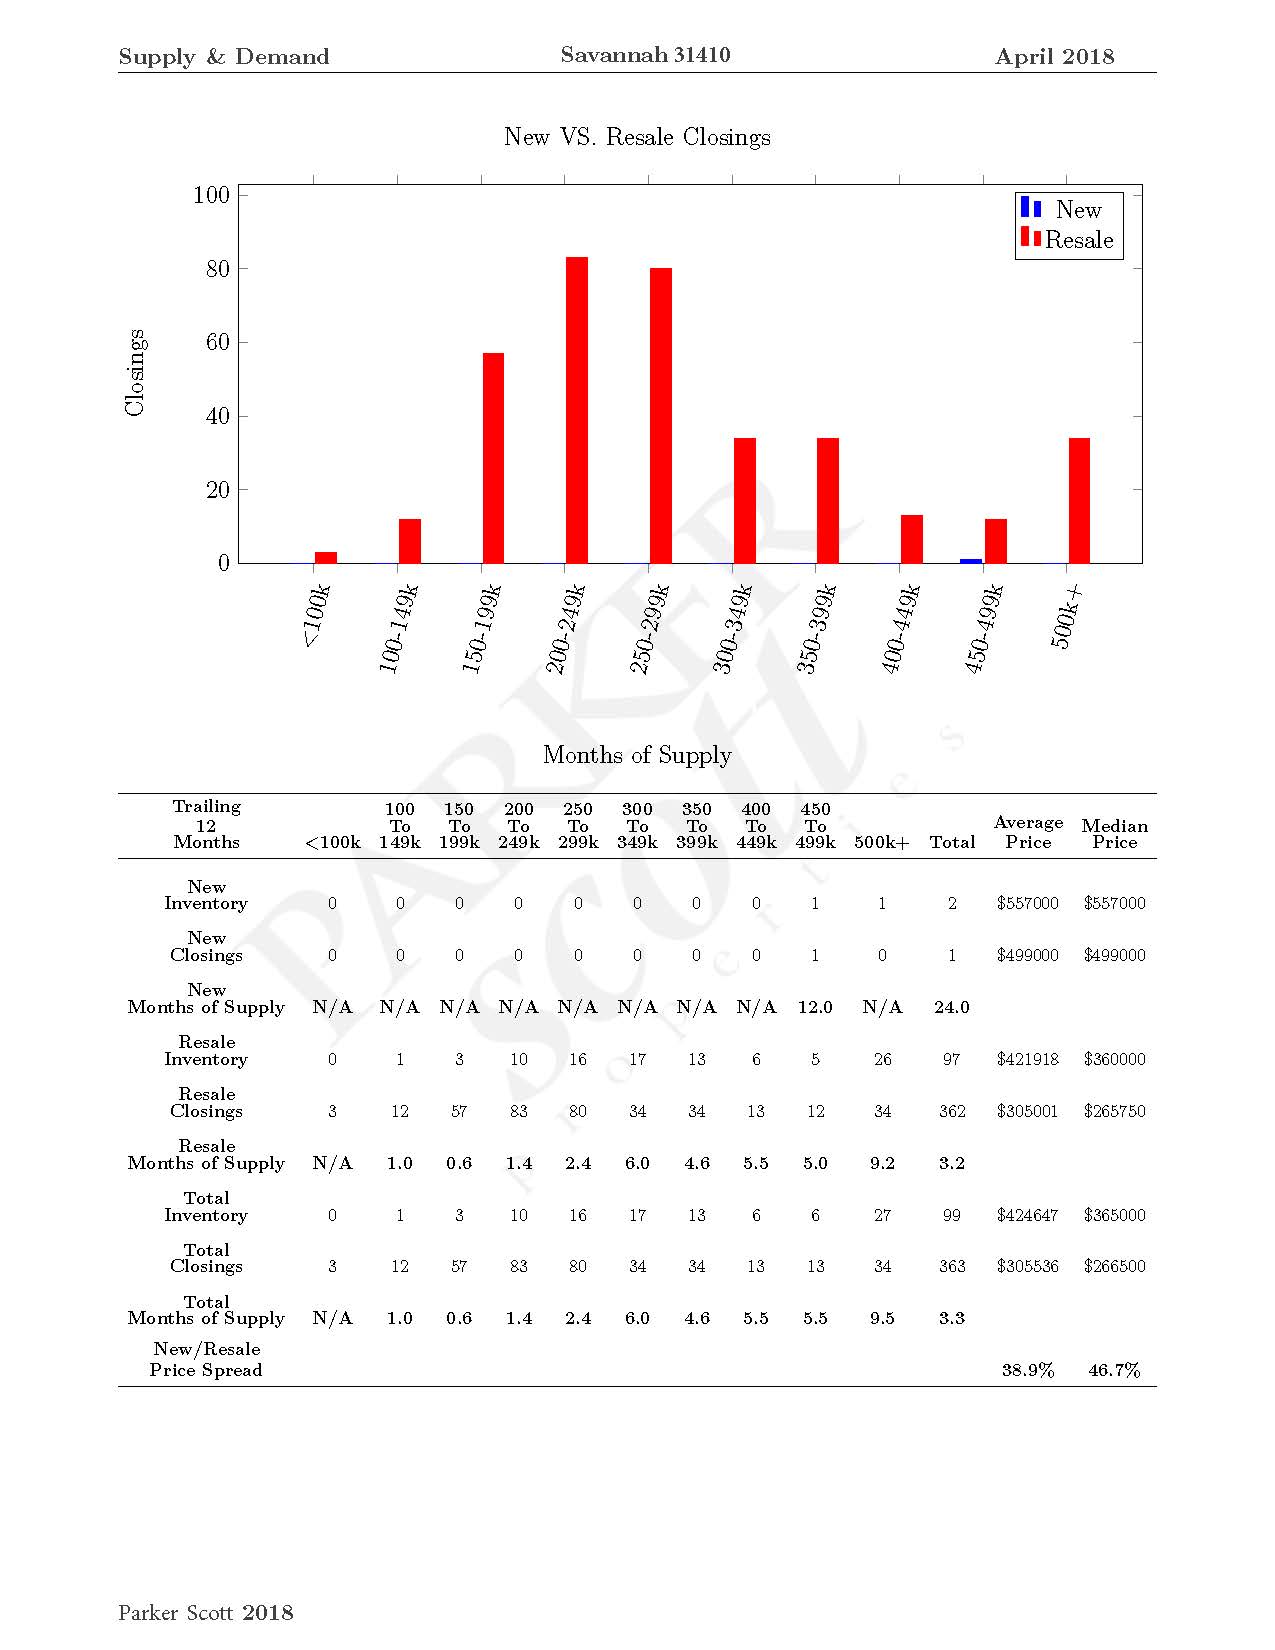
The highest percentage of homes sold were in the $200,000 to $249,000 pricepoint at 83% and the second highest pricepoint $250,000 – $299,000.
“IS THIS THE RIGHT TIME TO SELL”
The question would be “is this the right time to sell” and based on market conditions yes! There is a deficit for the surplus of resale homes in the 31410 area.
For a complimentary market study on your property, contact one of our experts today! 912-897-6320 or visit Parker Scott Experts
Coming up with a down payment strategy can be difficult for some buyers – especially first-time home buyers who don’t have the benefit of a home to sell. In fact, among first-time home buyers, nearly 60 percent put less than 20 percent down on their house. And while that can be a good option for some buyers, it does have downsides. For one, smaller down payments typically mean you’ll have to pay mortgage insurance. It also means you may be edged out when making an offer on a home. Data from Zillow shows that buyers with larger down payments are more likely to get their offer accepted. On the other hand, waiting to save a larger down payment means risking an increase in home prices that makes it so you can’t afford next year what you could afford right now. What is the best move for today’s buyer? Well that depends a lot on their personal financial situation and how much they already have saved. But, according to Zillow, the median home will be worth just over $6,000 more next year at this time – which means you’ll have to save an additional $105 per month to cover the rise in prices. More here.
This year’s real-estate market has been a mixed bag. On the one hand, demand from home buyers has been strong and an increasing number of renters say they hope to one day own a home. But though there has been strong demand from buyers, there has been a lack of homes available for sale in many markets. Low inventory has caused home prices to continuing rising and sales – though higher than the year before – to fall below expectations considering the level of demand from potential buyers. So what’s in store for next year? Well, Lawrence Yun, the National Association of Realtors’ chief economist, sees improvement. According to Yun, continued economic gains should lead to more home sales and more new home construction. However, because for-sale inventory will remain a concern, Yun is cautiously optimistic. “An overwhelming majority of renters want to own a home in the future and believe it is part of their American Dream,” Yun said. “Assuming there are no changes to the tax code that hurt homeownership, the gradually expanding economy and continued job creation should set the stage for a more meaningful increase in home sales in 2018.” More here.
A new survey from the National Association of Realtors shows Americans are optimistic about their economic situation and increasingly think now is a good time to buy or sell a home. The quarterly survey found a spike in both the number of current renters who think now is a good time to buy a house and homeowners who say it’s a good time to list their house. In fact, among current homeowners, the number who said it was a good time to sell hit a record high. Lawrence Yun, NAR’s chief economist, says the optimism is largely driven by economic conditions. “Jobs are plentiful, wage growth is finally showing signs of life, home values are up considerably in the past five years and the stock market is at record highs,” Yun said. “The economy is not perfect, and growth overall is still sluggish, but the financial health of the typical household looks as healthy as it has since the recession.” The survey’s results also show increasing positivity among Americans about their personal financial situation and their outlook for the next six months. More here.Parker Scott Properties Blog Money
Good landscape design can help you get a better price when it's time to move but will also help beautify your neighborhood and please your neighbors in the meantime. If you aren’t that handy in the garden, start with your lawn. A recent article from Freddie Mac lays out a number of tips to help you get started. Among them, good to first identify what type of grass you have. This will help you know what seed to buy if you need to fill any dead spots. You should also be careful not to cut your lawn too short or give it too much water. Grass needs a little length to help it absorb sunlight and maintain healthy roots. Too much watering can also damage roots and will cause more weeds to grow. Another tip is to be careful with fertilizers and pesticides. Break fertilizer applications up throughout the season rather than doing it all at once. And be careful with pesticides, as they may be more trouble than they're worth. According to the article, lawn issues are more likely going to be the result of water, weather and lawn mower damage than pests. Following these simple rules should help you achieve a greener and more luscious lawn. More here.
Whether you’re looking to buy a home or condo in the Savannah area or you’re ready to sell a home or condo in the Savannah area, home prices are likely a topic of great interest to you. For this reason, a couple of new reports deserve a closer look.
First, ATTOM Data Solutions just released their U.S. Home Sales Report for the third quarter. Among the results, the data shows that the median home price has now surpassed its pre-recession peak and is at an all-time high. In fact, the median price in the third quarter hit $230,000 – which is 1 percent higher than its previous peak of $227,000 in 2005. But though that sounds like bad news for buyers, there may be more to the story. That’s because another recent report shows that – though home prices continue to rise – in the Savannah area and elsewhere – so does the number of price reductions. That means, more sellers are adjusting their price after originally listing their house.
Whether this is because home sellers have just priced their property too high to begin with or are in markets where prices may have peaked is debatable. However, 70 of the largest 100 metropolitan areas saw an increase in price reductions. Of course, home price trends can vary from one location to the next. For example, ATTOM’s chief economist, Darren Blomquist, points out that, while prices have hit new peaks in some markets, there are also still markets where there are a high number of distressed properties and opportunities for buyers looking for a bargain. More here.
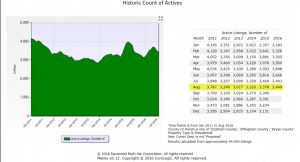
Studies from the Savannah Multi-list Corporation Combined Residential Sales Report for Bryan County, Chatham County and Effingham County, From January 2011 thru August 2016 with the results calculated from approximate 44,000 listings, not including new construction showed the monthly active listing per month in August 2016 on average have been 3,300 per month.
Savannah Multi-List Corporation Historic Count Activities Average Report January 2011 – August 2016
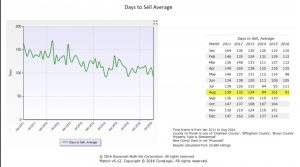
The average number of days on the market to sell, from August of 2011 at 139 days has declined in August of 2016 to 91 days on average.
Savannah Multi-List Corporation
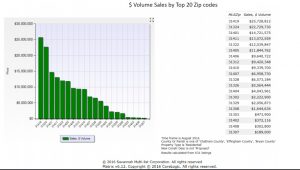
Results calculated from 631 listings, not including proposed new construction, show the sales volumes of the top 20 zip codes from August of 2016; the Savannah southside area zip code 31419 sales volume was the highest with $25,728,812, the Richmond Hill Bryan County area zip code 31324 came in second with an estimated sales volume of $22,729,730, and the third zip code was the downtown area zip code 31401 with a sales volume of $14,721,575. The following seventeen zip codes may be seen on the chart below.
Savannah Multi-List Corporation Savannah Area Volume Sales by top 20 Zip Codes Average Report January 2011 – August 2016
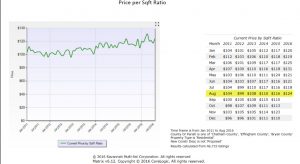
Based on the Savannah Multi-List Corporation Report, the Home Sales Price Per Square Foot Ratio for homes in the Bryan County, Chatham County and Effingham County from January 2011 thru August 2016 have continued to rise. In August of 2011 the home sales price per square foot ratio for homes in these areas were $104 per sqft, in August of 2012 the prices dropped to $99 per sqft, the following August of 2013 we saw an increase in the Savannah and surrounding areas with $108 per sqft, prices continued to rise in 2015 at $116 per sqft and this year in 2016 we saw a larger gain at $124 per sqft on average.
Savannah Multi-List Corporation Savannah Area Home Sales Price Per Square Foot Ratio Report January 2011 – August 2016
Because they are the two markets Americans are most likely to invest in, the stock market and housing market are often compared. Analysts and economists will break down the numbers in an effort to decipher which is the better long-term bet for your bottom line. Most recently, David M. Blitzer, managing director and chairman of the index committee at S&P Dow Jones Indices, took a look at the past several years and compared home price increases and the stock market rebound. “Since the last recession ended in June 2009, the stock market as measured by the S&P 500 rose 136 percent to the end of August while home prices are up 23 percent,” Blitzer said. “However, home prices did not reach bottom until February 2012, almost three years later. Using the 2012 date as the starting point, home prices are up 38 percent compared to 59 percent for stocks.” But, though stock market gains have outpaced price appreciation, real estate has an edge when comparing total value. In fact, Blitzer notes that Americans’ homes are valued at around $22.3 trillion, while the value of stocks and mutual funds is $21.2 trillion. More here.


 Good landscape design can help you get a better price when it's time to move but will also help beautify your neighborhood and please your neighbors in the meantime. If you aren’t that handy in the garden, start with your lawn. A recent article from Freddie Mac lays out a number of tips to help you get started. Among them, good to first identify what type of grass you have. This will help you know what seed to buy if you need to fill any dead spots. You should also be careful not to cut your lawn too short or give it too much water. Grass needs a little length to help it absorb sunlight and maintain healthy roots. Too much watering can also damage roots and will cause more weeds to grow. Another tip is to be careful with fertilizers and pesticides. Break fertilizer applications up throughout the season rather than doing it all at once. And be careful with pesticides, as they may be more trouble than they're worth. According to the article, lawn issues are more likely going to be the result of water, weather and lawn mower damage than pests. Following these simple rules should help you achieve a greener and more luscious lawn. More here.